Vanguard’s 2023 paper is the one everybody cites. In US data it found that putting a lump sum to work immediately beat splitting it into three monthly installments 66.4% of the time. The number that rarely travels with it is the margin: on $100,000 in a 60/40 portfolio, the median one-year outcome was $109,360 for lump sum against $107,453 for cost averaging. Vanguard calls that 1.8% more. In dollars, $1,907 — CentSheet’s subtraction of Vanguard’s two published median figures, one-year horizon, before tax.
Most people reading this will never make that decision.
The choice only exists if you are holding cash
FINRA’s definition, dated May 2026: “With dollar-cost averaging, you invest your money in equal portions, at regular intervals, regardless of current market conditions.” The SEC’s glossary says nearly the same thing, on a page carrying no date at all.
Now read that against a paycheck. A 401(k) deferral is equal portions, at regular intervals, regardless of market conditions. FINRA says so directly: anyone contributing to a 401(k) from each paycheck is likely already dollar-cost averaging. You cannot lump-sum money you do not yet have.
Vanguard draws the same line before its study begins: “In contrast to that, we are examining here what to do with a lump sum that is available immediately.” So the research applies to a bonus, an inheritance, a house sale, vested equity, back pay. If none of those has happened to you, this is spectator sport. It says nothing, in either direction, about whether paycheck contributions are wise. What the money eventually buys is a separate question — see index funds for beginners.
What the Vanguard study actually did
Publisher: Vanguard Research. Authors: Megan Finlay and Josef Zorn, Ph.D., CFP. Date: February 2023. Vanguard is an asset manager and an interested party — money invested sooner is money in funds sooner.
The method is narrow. Vanguard compared a lump sum against a three-month cost-averaging split — the sum divided into three equal parts, invested one month apart — and measured wealth after a one-year horizon, on a rolling basis. The base case assumes 100% equity and no interest at all on the money still sitting in cash. Global results use the MSCI World Index, 1976-2022; US results the Russell 3000, 1979-2022.
Headline global result: lump sum outperformed three-month cost averaging 68% of the time. Separately, cost averaging beat holding cash 69% of the time, with cash proxied by the 3-month Treasury bill rate.
The US numbers:
| Cost-averaging split | Share of rolling periods lump sum ended ahead |
|---|---|
| 3 months | 66.4% |
| 4 months | 69.9% |
| 5 months | 72.6% |
| 6 months | 73.7% |
Russell 3000, 1979-2022, one-year horizon. Vanguard Research, Appendix 1, Figure 6.
Vanguard’s reading: the longer the schedule, the greater the opportunity cost. Other developed markets at the three-month split clustered between 66.5% and 68.1%; emerging markets (MSCI EM, 1988-2022) was the outlier and the weakest case for lump sum at every split length, running 61.6% to 62.9%.
Two notes. Vanguard’s headline global figure is 68% while its appendix row for the global USD series reads 67.7%; the paper does not explain the difference and we will not guess. And “lump sum wins between 61.6% and 73.7% of the time” gets quoted as one finding. It is not: 61.6% is emerging markets on a three-month split, 73.7% the US on a six-month split.
A hit rate is not a margin
66.4% describes how often, not by how much. Vanguard’s median gaps over one year were 2.2% for a 100% equity portfolio, 1.8% for 60/40 and 1.2% for 40/60. Its explanation is mechanical rather than mysterious: months spent partly in cash are months not earning the risk premium.
It is also a one-year measurement: the study captures whatever the entry method does at the twelve-month mark and stops. To see how a gap that size behaves when left alone, put your own numbers into the compound interest calculator rather than Vanguard’s $100,000.
Cost averaging won in the worst outcomes
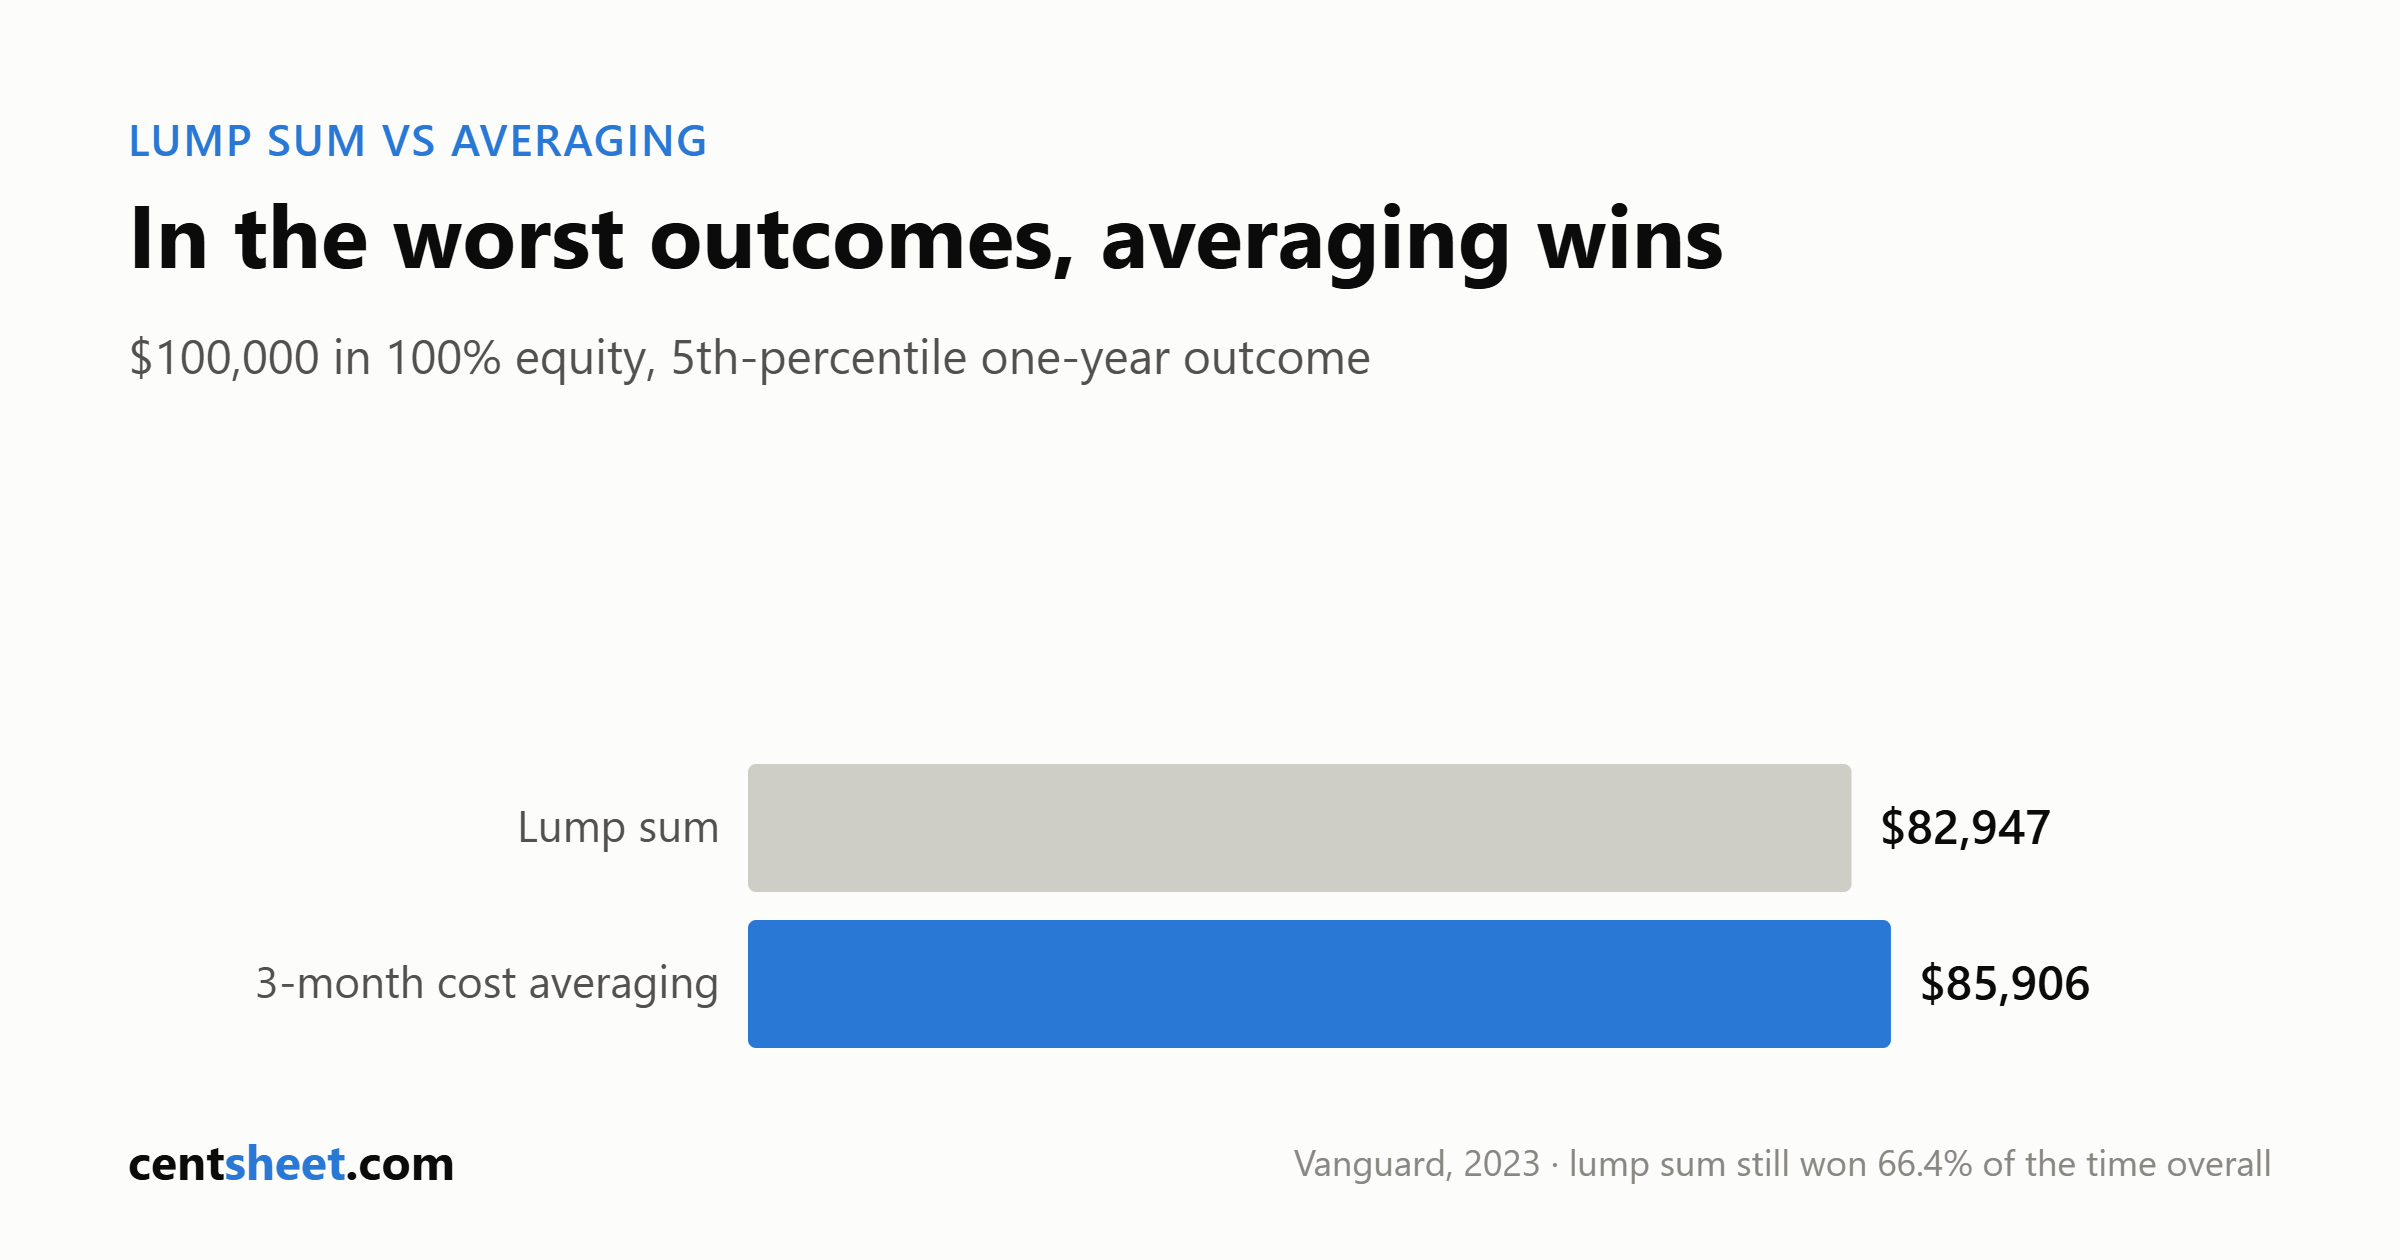
This part gets left out of the summaries, and it comes from the firm arguing the other way. At the 5th percentile of historical one-year outcomes, cost averaging finished ahead:
| Portfolio and percentile | Lump sum | 3-month cost averaging | Ahead |
|---|---|---|---|
| 100% equity, 5th percentile | $82,947 | $85,906 | Cost averaging |
| 40/60, 5th percentile | $97,144 | $97,701 | Cost averaging |
| 60/40, median | $109,360 | $107,453 | Lump sum |
$100,000 invested, one-year horizon. Vanguard Research, Figure 3.
Vanguard states the boundary itself: lump sum “outperforms in all but the worst outcomes (below the 25th percentile),” and its recommendation “is based on the more likely scenarios between the 25th and 75th percentiles.”
That is the honest shape of the trade. Cost averaging historically gave up something in the middle of the distribution and bought back something in the left tail. Nothing here tells you which part of it the next twelve months belong to. Every figure in this article is a count of what already happened.
The base case assumes your cash earns nothing
Vanguard ran the sensitivity test. Credit the uninvested cash with interest at the 3-month Treasury bill rate instead of 0%, and lump sum’s win rate for an all-equity portfolio falls from 68% to 65%. Vanguard’s wording: “as cash interest increases, LS’s advantage diminishes, all other things being equal.”
That assumption does real work in the headline number, and it is an assumption about your bank, not the stock market — see HYSA vs CD vs T-bills. We are not printing a current cash yield here: the paper is from February 2023 and its rate environment is not necessarily yours.
The regret argument, on its own terms
The case for cost averaging is usually made emotionally, and usually dismissed as merely emotional. Vanguard modeled it instead.
In a utility model with loss aversion set at 2.50 and risk aversion at 3, 6 and 10 (adventurous, moderately conservative, very conservative), two of the three personas preferred cost averaging once loss aversion was included. Without it, only the very conservative one did. Vanguard’s summary line: “Despite the expectation of lower returns, cost averaging might be considered for investors with very high aversion to both risk and losses who might be tempted to hold a lump sum entirely in cash.”
Read the condition at the end of that sentence. The comparison that makes cost averaging look good is not a schedule versus a lump sum — it is a schedule versus the money never going in at all. Hence Vanguard’s other number: cost averaging beat cash 69% of the time.
FINRA lists similar benefits — it “can remove some of the emotion from investing and might help you avoid making impulsive decisions” — while citing no study anywhere on the page. It is equally blunt about the price: investing gradually “has lower risk but often produces lower returns than lump sum investing, especially over longer periods.”
One thing dollar-cost averaging categorically does not do is protect a portfolio you already own. Holdings already in the market are exposed whether they arrived in one payment or six. Conflating the two is the most common mistake in articles on this subject.
The “protects you from yourself” case is contested
The strongest argument for a schedule is that it stops you doing something worse. It leans on the behavior gap, currently the subject of an unresolved fight.
Morningstar’s “Mind the Gap 2025,” published 13 August 2025 with Jeffrey Ptak as lead author, compares dollar-weighted investor returns against time-weighted total returns. Over the 10 years ended 31 December 2024, the average dollar in US mutual funds and ETFs earned 7.0% a year against an 8.2% aggregate total return — a 1.2 percentage point gap, “equivalent to around 15% of the funds’ aggregate total return.” Sorted by cash flow volatility as a proxy for trading, the gap ran from -0.8% to -1.8% a year. Morningstar sells data and research; not a neutral party either.
On 12 May 2026 the peer-reviewed Financial Analysts Journal published Fulkerson, Jordan, Riley and Yan re-running it. Their finding: “using the same sample, poor timing by mutual fund investors costs them only 0.10% per year.” Roughly a twelvefold difference on the same data, under the title “Bad Timing Does Not Cost Investors 15% of Their Funds’ Returns.”
We will not tell you which is right. But any case for cost averaging that rests on a large behavior gap rests on a disputed number.
The panic premise is shakier than it sounds too. The FINRA Investor Education Foundation, with NORC at the University of Chicago, surveyed 1,795 households from a probability-based panel between 29 May and 16 June 2020 — weeks after the February-March crash. Only 34% made any trade at all, and more bought (26%) than sold (21%). Vanguard’s “How America Saves,” published 16 June 2026 from recordkeeping data on nearly five million workers, reports that “only 5% of participants traded during periods of volatility” — its own book of 401(k) savers, not US investors generally.
The same survey found 42% of respondents saying they were newly willing to take less financial risk, while on an objective measure against the same panel’s 2018/2019 answers only 12% showed lower risk tolerance and a quarter showed higher. People are not reliable narrators of their own nerve, in either direction. And none of this measures what selling cost anyone. Nobody publishes that number.
Who benefits from the simple version
Vanguard’s retail-facing page compresses the whole study into: “Our research indicates that it’s wise to invest a lump sum immediately.” The page carries no date. A 66-to-68%-of-the-time historical result has become a rule, with the other 32% of periods and the 5th percentile edited out. The caveats are all in the underlying paper; the compression happens downstream, on the page written for customers by a firm whose funds receive the money. CentSheet reports that Vanguard recommends this. We do not recommend it.
The SEC points the other way, with its own asterisk. A former director of its Office of Investor Education wrote that when markets drop, “your regular contribution actually acquires more shares of the fund, setting you up for gains when the market recovers.” The SEC now flags that page as no longer updated and possibly outdated, it carries no date, and the sentence assumes a recovery.
What to actually do
1. Establish whether you have this decision at all. Money arriving by paycheck is already dollar-cost averaging by construction, and none of this research applies to it. 2. Treat the studies as what they are: a count of one-year rolling outcomes in specific indexes over specific windows, not a forecast. 3. Look at the margin, not only the hit rate. Vanguard’s median one-year gaps were 2.2%, 1.8% and 1.2% by stock/bond mix. Run your own amount through the compound interest calculator. 4. Check what the uninvested portion would earn. Vanguard’s headline assumes zero; crediting T-bill interest cut lump sum’s all-equity win rate from 68% to 65%. See HYSA vs CD vs T-bills. 5. If you choose a schedule, fix the dates before the first installment. A schedule you revise when prices move is not cost averaging — it is timing with extra steps, and it shields nothing you already own. 6. Money you might need inside a year raises a different question — see how much emergency fund you need.
CentSheet publishes educational content, not personalized financial advice. Nothing here is a recommendation of any fund, firm or strategy, and no historical result described here is a prediction of future returns.
Get the CentSheet Money Brief
Email me CentSheet weekly: practical money decisions, new calculators, and useful worksheets. Unsubscribe anytime.