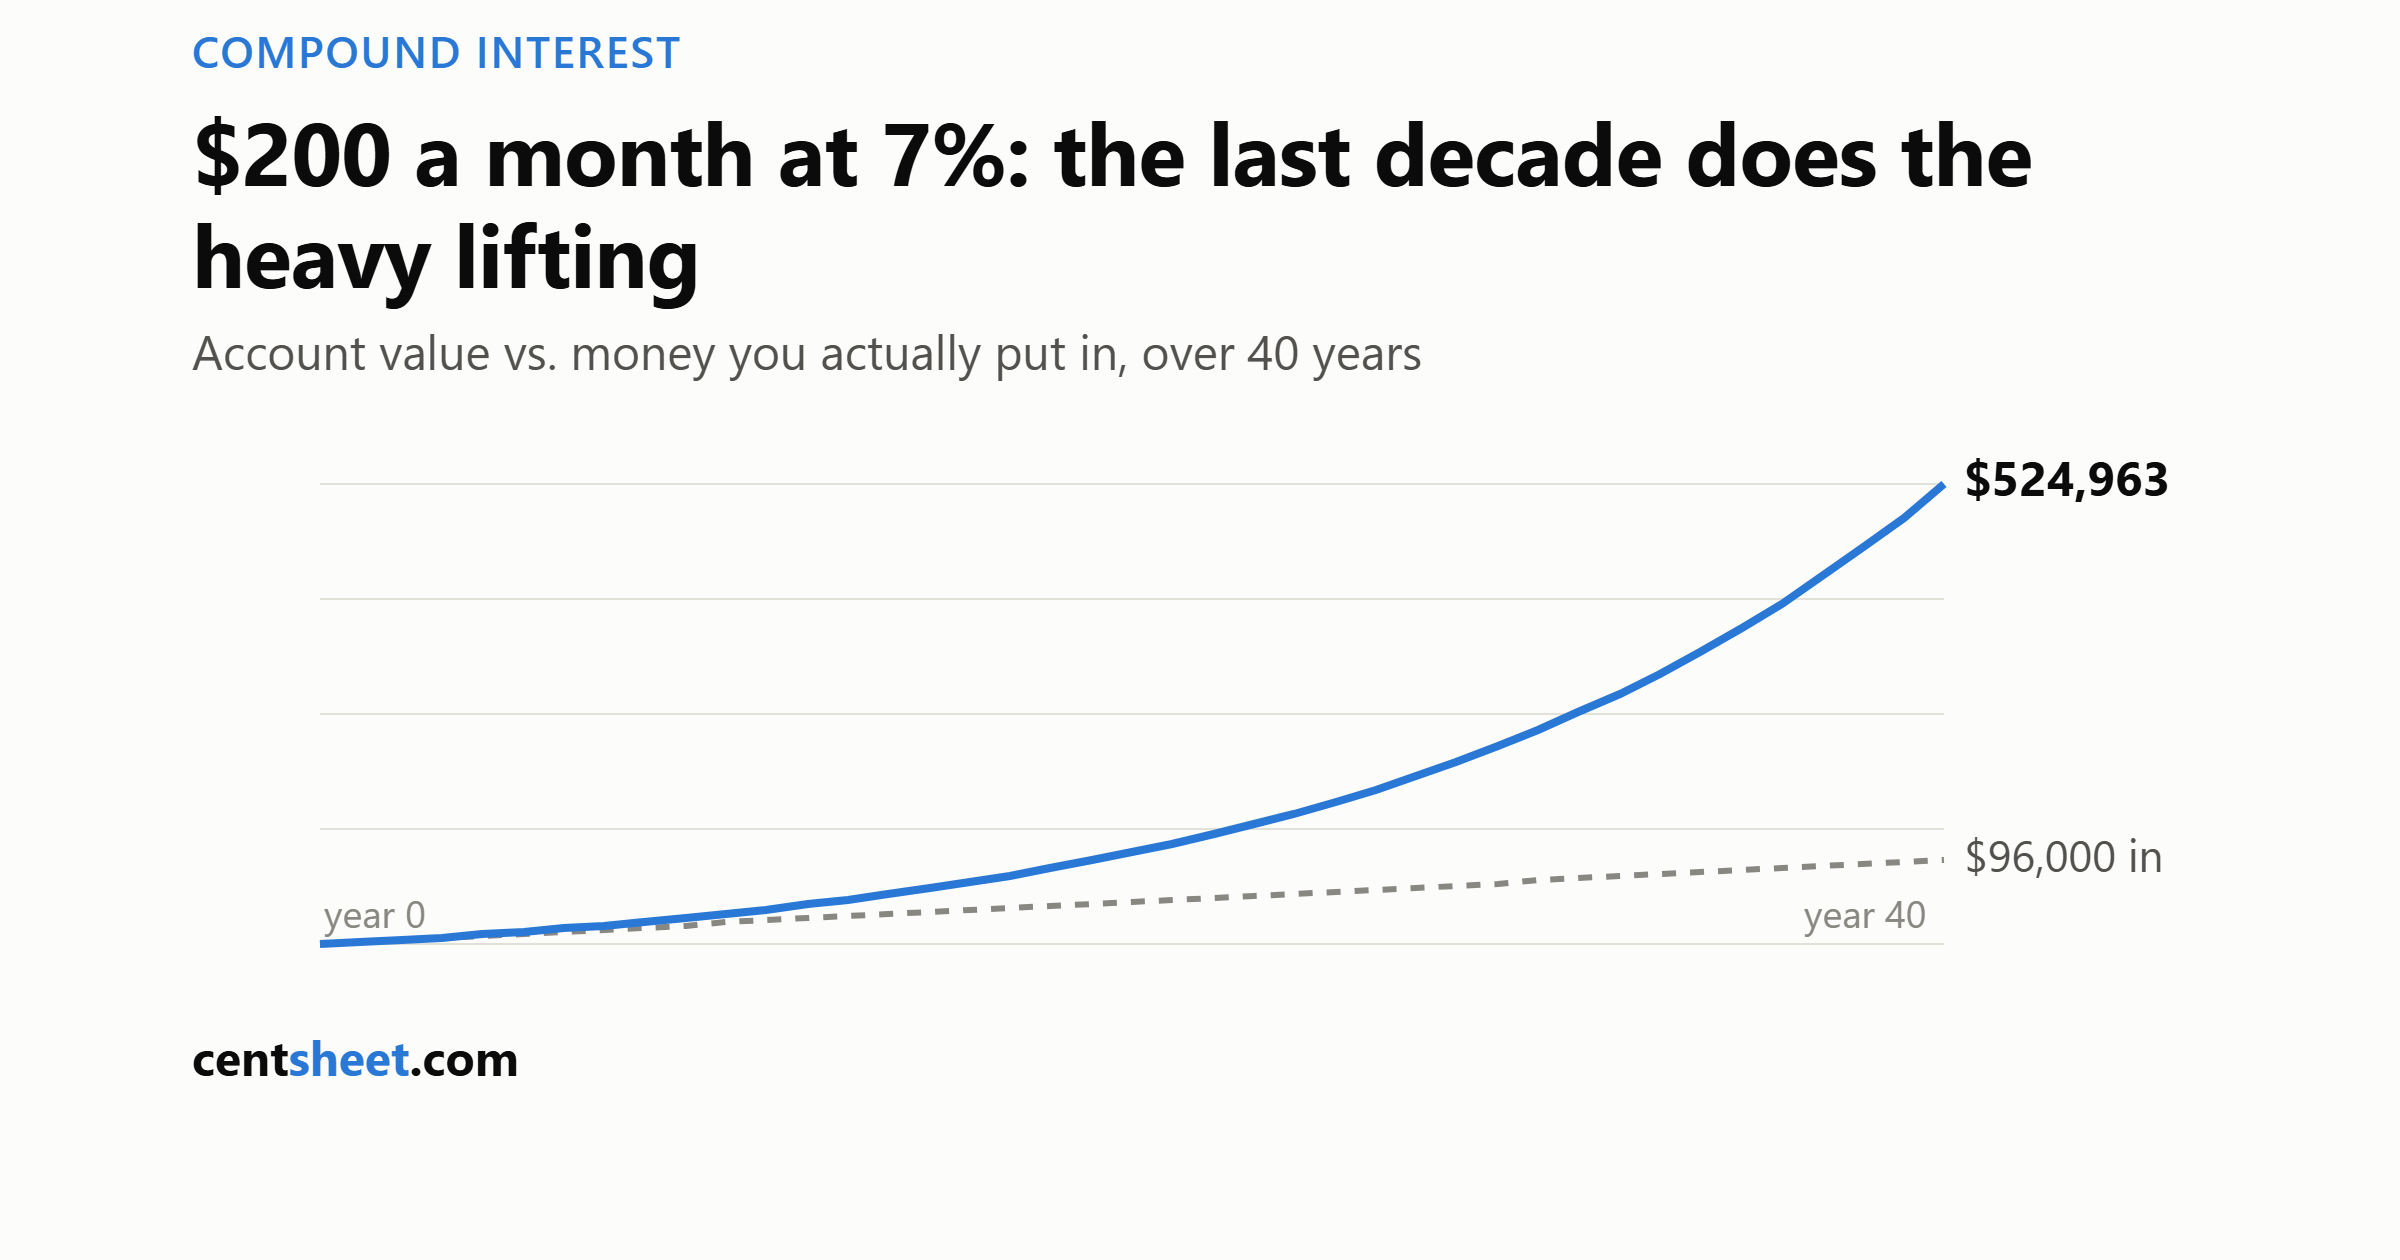
Every compound interest article quotes Einstein (he almost certainly never said it) and shows a hockey-stick chart with no numbers on the axes. This one just shows the numbers.
The setup: you invest $200 every month and it grows at 7% a year, compounded monthly. Here’s what you have over time, next to what you actually put in:
| After | You contributed | It’s worth | Growth |
|---|---|---|---|
| 10 years | $24,000 | $34,617 | $10,617 |
| 20 years | $48,000 | $104,185 | $56,185 |
| 30 years | $72,000 | $243,994 | $171,994 |
| 40 years | $96,000 | $524,963 | $428,963 |
Read the last column top to bottom. That’s the entire lesson of compounding in four numbers.
The first decade is genuinely unimpressive
After ten years of discipline you’ve turned $24,000 into $34,617. Solid — but nobody’s writing headlines about it. This is where most people conclude compounding is overrated and stop.
The problem is that compounding’s payoff is loaded at the end. In decade one, growth added $10,617. Between years 30 and 40 — same $200/month, same 7% — it added $280,969. The last decade produces more growth than the first three combined, because by then the money doing the earning is mostly earnings.
That’s not magic. It’s just exponential arithmetic meeting human impatience, and losing the early rounds.
What waiting ten years actually costs
Two people invest $200/month at 7% until age 65. One starts at 25, the other at 35.
- Start at 25: $524,963
- Start at 35: $243,994
The ten-year head start cost $24,000 of extra contributions and produced $280,968 more money. The person who started earlier ends up with more than double, having contributed only a third more. There is no catch-up mechanism: the 35-year-old who wants the 25-year-old’s outcome needs to contribute roughly $430/month, not $200.
If you take one action from this article, it’s this: the start date matters more than the amount. $50/month at 25 beats $0/month while waiting until you can “afford” $200.
The rate matters — but you don’t control it
Same $200/month for 30 years at different growth rates:
| Rate | After 30 years |
|---|---|
| 5% | $166,452 |
| 7% | $243,994 |
| 10% | $452,098 |
A useful mental shortcut for these gaps is the Rule of 72: money doubles roughly every 72 ÷ rate years. At 7%, that’s about every 10.3 years — so a 40-year horizon holds roughly four doublings.
You don’t get to choose your rate — markets deliver what they deliver. You choose the two inputs that are yours: the monthly amount and, above all, the number of years. Which is why fees deserve one sentence here: a fund charging 1% more than an equivalent one isn’t taking “1%,” it’s moving you down a full row in this table.
About that 7%
An honesty note most articles skip: 7% is a long-run, inflation-adjusted-ish assumption commonly used for broad US stock index returns, and it is an average, not a promise. Real decades have delivered far more and far less, in no predictable order. The table’s smooth curve never happens; the destination values over long horizons are what the assumption is for. Anyone showing you 12% projections is selling something.
Compounding also runs in reverse gear beautifully: a credit card at 24% APR is the same table working against you at triple the rate. That’s why paying off high-interest debt is the best guaranteed “return” most households can buy.
One lump sum, for comparison
$10,000 invested once at 7% and left alone for 30 years: $81,165 — an eightfold multiple with zero further effort. Windfalls (bonus, tax refund, inheritance) are compounding’s best raw material, because they put maximum dollars at the start of the curve, where time is longest.
The boring conclusion that happens to be true
Compounding rewards exactly two behaviors: starting now, and not stopping. Everything else — rate chasing, timing, tinkering — is noise against those four numbers in the first table. $200 a month is $6.60 a day. The 40-year row is half a million dollars.
CentSheet publishes educational content, not personalized financial advice. Projections are mathematical illustrations at an assumed constant rate, which real markets will not deliver smoothly.
Get the CentSheet Money Brief
Email me CentSheet weekly: practical money decisions, new calculators, and useful worksheets. Unsubscribe anytime.