Vanguard’s VOO and VFIAX are the same fund — one portfolio, two share classes. Over the ten years to July 31, 2026, Vanguard reports the mutual fund class (VFIAX) returned an average of 15.04% a year, and the ETF class (VOO) returned 15.04% at net asset value and 15.05% at market price, against a benchmark Vanguard puts at 15.08%. Those are trailing figures carrying the standard disclaimer, and they predict nothing. But they answer the question people are actually asking: same strategy, two wrappers, ten years, and the gap showed up in the second decimal place.
The comparison is a category error: an index fund is a strategy, an ETF is a container, and most large index funds come in both.
An index fund is a strategy, an ETF is a wrapper
The SEC’s definition is explicit: “An ‘index fund’ is a type of mutual fund or exchange-traded fund that seeks to track the returns of a market index” (Investor Bulletin: Index Funds, dated August 2018 — old, and still the agency’s framing). The opposite of an index fund is an actively managed fund; the opposite of an ETF is a non-exchange-traded mutual fund. Two different axes.
One strategy — track the S&P 500 — in six products, three of each wrapper:
| Fund | Wrapper | Expense ratio | Minimum |
|---|---|---|---|
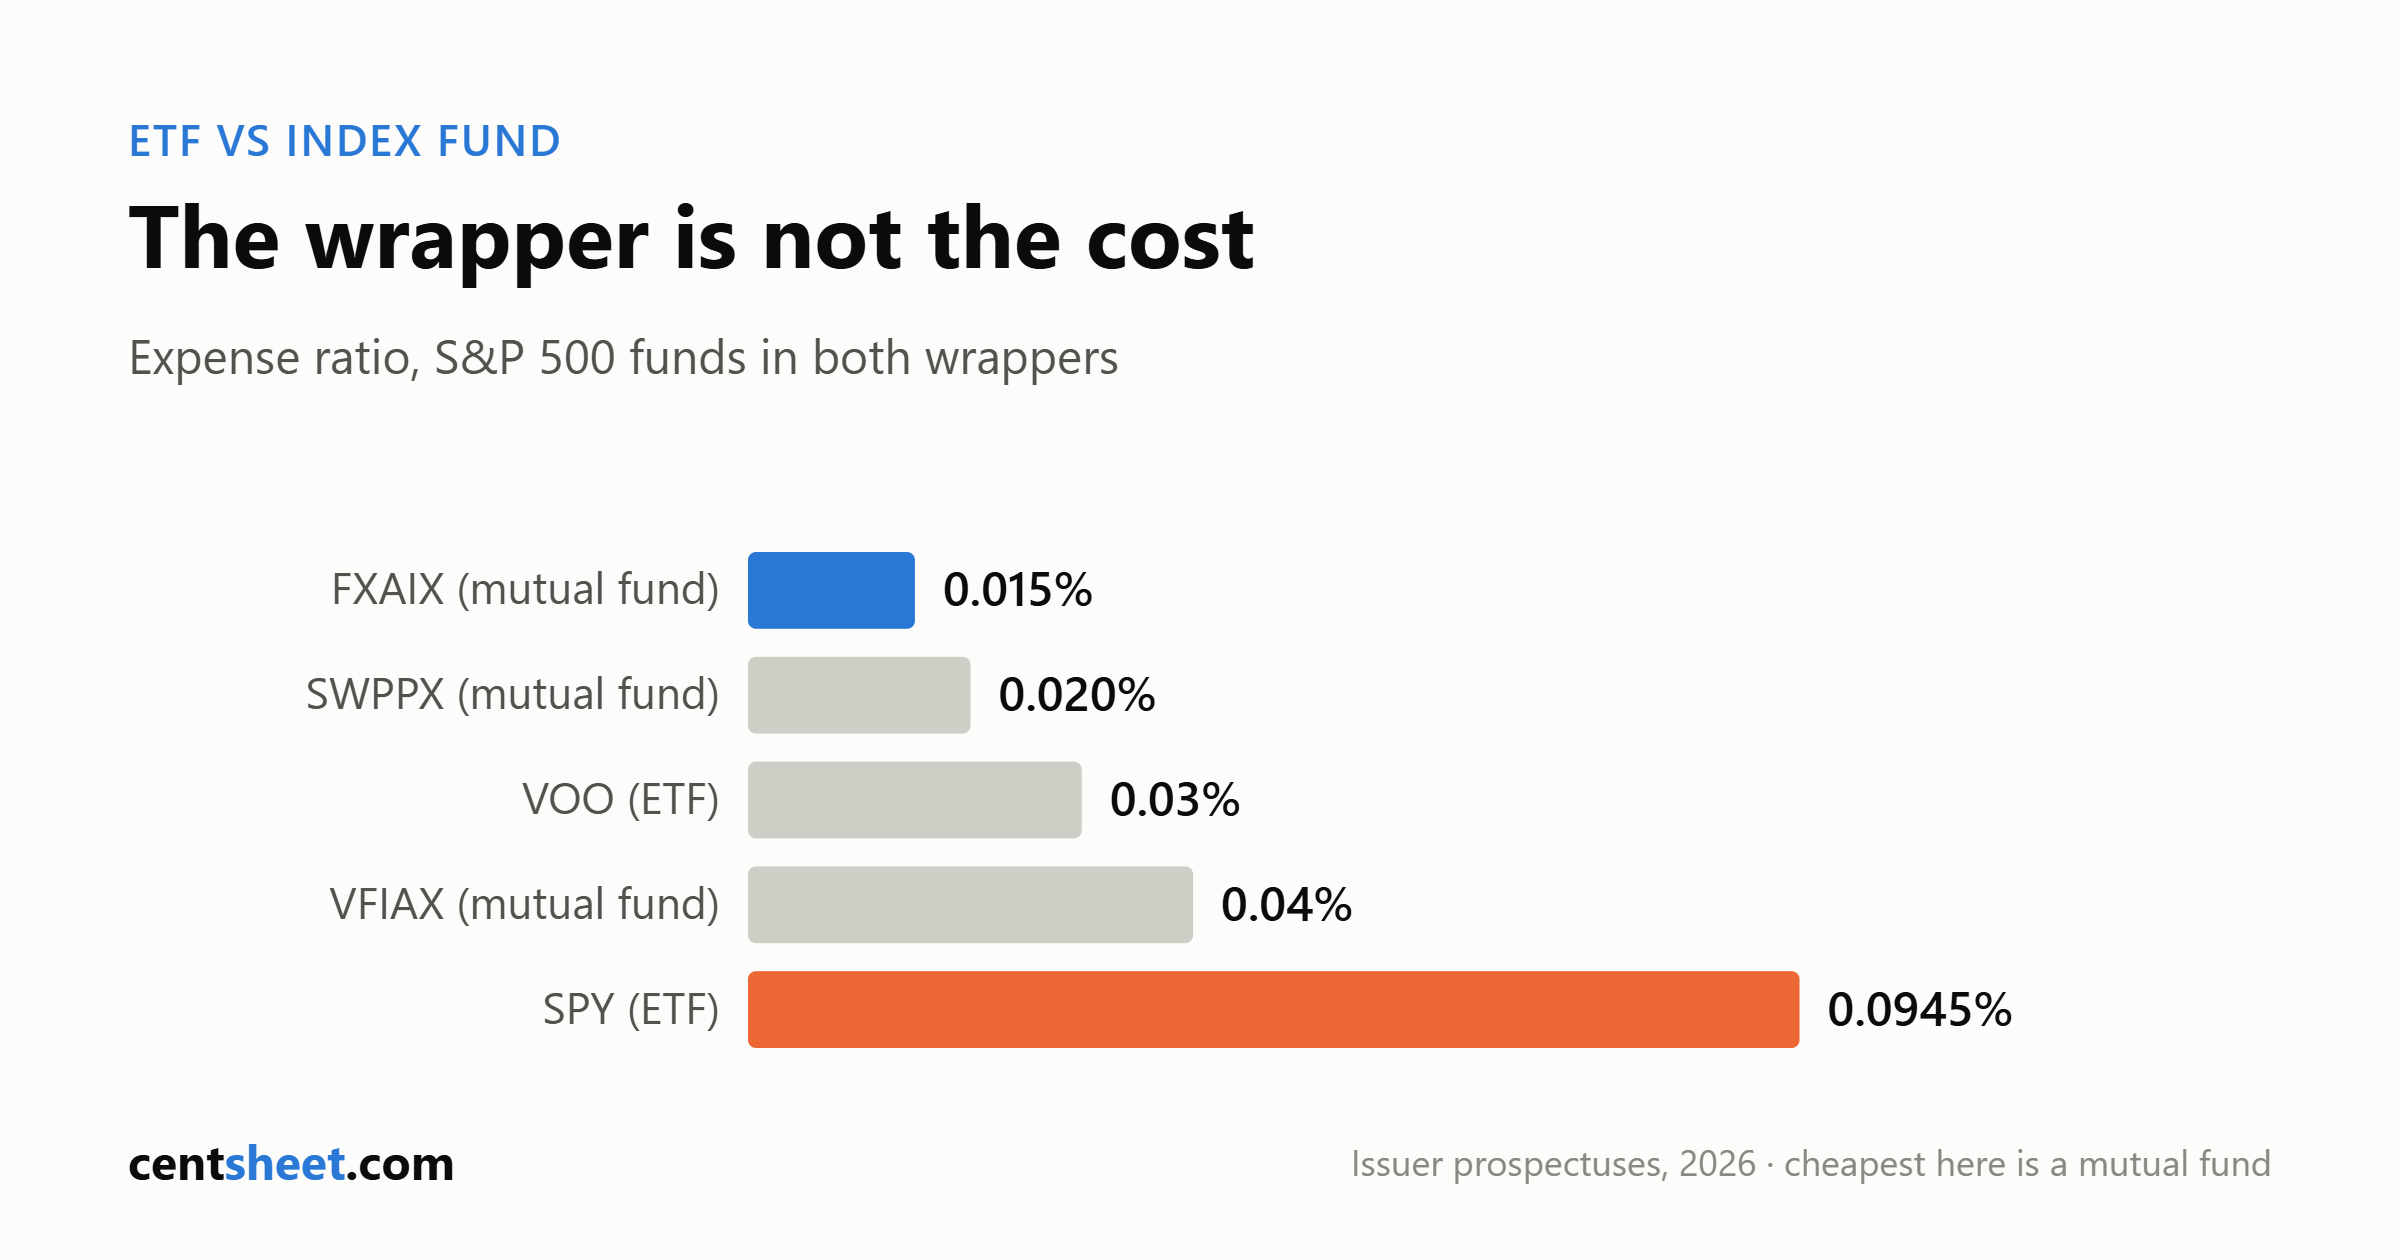
| Fidelity 500 Index (FXAIX) | Mutual fund | 0.015% | $0 |
| Schwab S&P 500 Index (SWPPX) | Mutual fund | 0.020% | No minimum |
| Vanguard S&P 500 ETF (VOO) | ETF | 0.03% | Price of one share |
| iShares Core S&P 500 (IVV) | ETF | 0.03% | Price of one share |
| Vanguard 500 Index Admiral (VFIAX) | Mutual fund | 0.04% | $3,000 |
| SPDR S&P 500 ETF Trust (SPY) | ETF (a unit investment trust) | 0.0945% | Price of one share |
Expense ratios per each issuer’s own page: Vanguard as of April 28, 2026; Fidelity as of April 29, 2026; iShares per current prospectus; Schwab and State Street retrieved August 6, 2026. Minimums as of August 5–6, 2026.
The wrapper stops predicting the cost. The two cheapest funds in that table are mutual funds. The most expensive is an ETF — SPY’s 0.0945% is roughly three times VOO’s or IVV’s 0.03%, and SPY is a unit investment trust launched in January 1993. If you are still building the base layer, start with index funds for beginners.
Pricing: once a day versus all day
Per the SEC, mutual fund investors buy and sell “at the NAV per share,” which “is typically calculated at the end of each business day,” while “ETF investors can buy and sell ETF shares on a national stock exchange at the prevailing market price throughout the trading day.”
That market price is not the NAV. State Street says so on SPY’s own page: shareholders “may pay more than a fund’s NAV when purchasing fund shares and may receive less than a fund’s NAV when selling.” The gap is small at this size and runs both ways — SPY’s Rule 6c-11 disclosure shows it closed at a premium on 123 days and a discount on 127 days in calendar 2025. On August 5, 2026, VOO’s market price was $707.60 against a NAV of $707.72, a discount of 0.02%.
The bid-ask spread is the other price. The SEC calls it “a hidden cost to investors since spreads reduce potential returns.” Since Rule 6c-11 took effect in December 2019, covered ETFs must publish their median spread over the most recent 30 calendar days, measured from the national best bid and offer at 10-second intervals. As of August 5, 2026 those medians were 0.00% for SPY and 0.01% each for IVV, ITOT and VOO.
A rounding error — on these funds. Every ETF in our data is a mega-cap broad-index product; we did not verify spreads on thinner or niche ETFs, so do not assume the number carries. The issuer has to publish it — look it up.
Creation, redemption, and where the tax story comes from
An ETF share is not individually redeemable. State Street: “Investors may acquire ETFs and tender them for redemption through the Fund in Creation Unit Aggregations only.” Large broker-dealers called authorized participants deposit a basket of securities and receive ETF shares, or hand shares back and receive the basket. The SEC illustrates these blocks with 50,000 shares, but that is an example only: sizes vary by fund, and the Rule 6c-11 amendments eliminated creation-unit-size disclosure entirely. The consequence, per the SEC’s April 2025 bulletin: “Because many ETFs buy and sell portfolio securities in in-kind exchanges (rather than for cash), they typically have fewer capital gains distributions — and thus lower taxes — than mutual funds.”
The tax-efficiency claim weakens on the funds you’d actually buy
The mechanism is real. Whether it matters inside a broad index fund is another question, and the data does not support the blanket version. Fidelity 500 Index Fund (FXAIX) is a plain mutual fund with no ETF share class; its most recent capital gains distribution, per Fidelity’s history retrieved August 6, 2026, was April 5, 2019 — roughly seven years without one. iShares’ IVV table shows its ten most recent distributions, March 2024 through June 2026, were 100% income with $0.000000 in capital gains. Neither trades much: reported turnover runs 2.00% (FXAIX, 08/31/2025), 2.4% (VOO, fiscal year-end 12/31/2025) and 3.49% (SWTSX, 06/30/2026).
What does show up is ordinary tax on dividends. Two ETFs on one date (June 30, 2026): iShares reports IVV’s 10-year average annual return as 15.47% before tax, 15.01% after tax on distributions and 12.95% after tax on distributions and sale of shares. State Street reports SPY at 15.35%, 14.91% and 12.85%. Issuers note these assume the highest individual federal marginal rates, exclude state and local tax, and are irrelevant inside a tax-deferred account — the clause that matters most. In a 401(k) or IRA the tax argument between these wrappers is close to immaterial.
Minimums and fractional shares
FINRA states mutual funds typically require minimums of $500 to $3,000, versus a share price for an ETF. True as a pattern, false as a rule about the funds most people buy: Fidelity’s index mutual funds (FXAIX, FSKAX, FZROX) all show a $0 minimum and Schwab’s (SWPPX, SWTSX) show “No Minimum.” Vanguard’s Admiral shares require $3,000 — which is why VOO exists as a share class of the same fund, available per Vanguard from $1.
One asymmetry: the SEC warns that “You generally cannot transfer fractional shares to another brokerage firm.” Buy ETFs in fractions, move brokerages later, and those fractions may have to be sold.
Settlement: we could not verify it
People ask how many days it takes to get cash after selling. Nothing in our sourced material gives a retail settlement cycle for either wrapper, and we are not answering from memory. The one settlement figure in Rule 6c-11 — up to 15 days to deliver redemption proceeds on foreign holdings — governs the fund’s dealings with authorized participants, not your sell order. Ask your broker.
Tracking difference, and a number the issuers disagree on
Two ETFs, same index, same date (June 30, 2026). iShares reports IVV at 15.47% at NAV over ten years against a benchmark it states as 15.50% — a shortfall of 0.03 percentage points a year, equal to its expense ratio. State Street reports SPY at 15.35% against a benchmark it states as 15.51%, a shortfall larger than its expense ratio. We can report the structure (SPY is a unit investment trust; Rule 6c-11 excludes UITs) and the numbers. We did not verify a cause from any prospectus, so we are not inventing one.
Note also that the issuers do not agree on what the index itself did — State Street says 15.51%, BlackRock says 15.50%, same as-of date, both retrieved August 6, 2026. Probably rounding or a different total-return series. There is no neutral third number, so cite whichever issuer you are reading and do not average them.
The holdings disagree too. S&P Dow Jones Indices reports 503 constituents in the S&P 500, not 500, because some companies have two share classes in it — and the funds report different counts again: Schwab SWPPX 503 and Vanguard VOO 506 (both 06/30/2026), iShares IVV 504 (08/05/2026), Fidelity FXAIX 508 holdings across 502 issuers (06/30/2026). There is no single correct number. Total-market funds diverge far more: on June 30, 2026, FSKAX reported 3,778 holdings and SWTSX reported 2,859, both naming the Dow Jones U.S. Total Stock Market Index. That is sampling, not error, but nobody can say “a total market fund holds about X stocks” without naming the fund. Fidelity puts its S&P 500 fund’s top 10 at 36.39% of the portfolio against 32.15% for its total-market fund, same date — which is a bigger decision than the wrapper.
Costs, and who benefits from the simple rule
Expense ratios are not billed to you and never appear on a statement. The SEC: “When fund fees are paid out of fund assets, the value of the fund decreases and the value of all the investors’ shares decreases.” Fidelity translates its 0.015% into dollars on its own page: $0.15 per $1,000. CentSheet’s calculation for the VOO/VFIAX pair: on a $10,000 balance held flat for a year, 0.03% is $3 and 0.04% is $4 — the entire annual cost difference between the two wrappers of that fund. Assumptions: flat balance, no trading, no spread, no commission.
Bigger gaps compound. The SEC’s example takes $100,000 growing 4% annually for 20 years: about $208,000 at a 0.25% annual fee, about $198,000 at 0.50%, about $179,000 at 1.00%. The SEC does not state the dollar gap between those and neither will we — run your own with our compound interest calculator.
Two costs live mostly on the mutual fund side: distribution (12b-1) fees, which the SEC says “typically apply to mutual funds but not to ETFs” and which FINRA caps at 1% of your assets in the fund, and sales loads, typically 2% to 5% front-end per FINRA. Major index funds generally carry neither — FXAIX shows 12b-1 fees of 0.00% — but check fund by fund.
Notice who benefits from the “ETFs are cheaper and more tax-efficient, full stop” line. It sells a product category, and it does not survive contact with a 0.015% index mutual fund that has not distributed a capital gain since 2019.
What to actually do
1. Decide the strategy first — which index, and how broad. That choice separated 36.39% top-ten concentration from 32.15%; the wrapper choice moved a ten-year return by 0.01 percentage points. 2. If the money is going into a 401(k) or IRA, stop optimizing here. The tax argument is explicitly not relevant to tax-deferred accounts, per the issuers’ own disclosures. 3. Compare expense ratios across wrappers, not within one. The cheapest fund tracking your index may well be a mutual fund. 4. If you buy an ETF, check its published 30-day median bid-ask spread before assuming it is negligible. 5. If you invest a fixed amount every payday, the mutual fund’s dollar-denominated purchase is simpler and sidesteps the fractional-share transfer problem. 6. Take the ETF if you want intraday execution, limit orders, or a brokerage that does not offer the mutual fund. Those are the honest reasons. 7. Do not switch an existing taxable holding from one wrapper to the other to save a basis point. Selling is a taxable event; 0.01 percentage points is not a reason to trigger one.
CentSheet publishes educational content, not personalized financial advice, and nothing here is tax advice. All figures are trailing or as of the dates stated and are not forecasts.
Get the CentSheet Money Brief
Email me CentSheet weekly: practical money decisions, new calculators, and useful worksheets. Unsubscribe anytime.