In June 2026 the Atlanta Fed’s Wage Growth Tracker put 12-month wage growth for people who had changed jobs at 4.1%, and for people who had stayed in the same job at 3.4%. A gap of 0.7 percentage point. Both are three-month moving averages of the median wage change for the same individuals observed a year apart, from Current Population Survey microdata — not this year’s payroll against last year’s.
That gap is the strongest argument you can carry into a raise conversation, and the one most likely to be oversold. It is a reading with a date on it, not a rule: the premium has been much smaller at other points, and a press account from August 2025 reported it had inverted outright, with stayers ahead. We could not verify that report. Treat the direction as something that moves.
Two caveats the Atlanta Fed publishes and most write-ups drop: the CPS sample behind the tracker was 10% smaller in November and December 2025 than in September 2025, widening confidence intervals, and the October 2025 observation does not exist, a casualty of the federal shutdown.
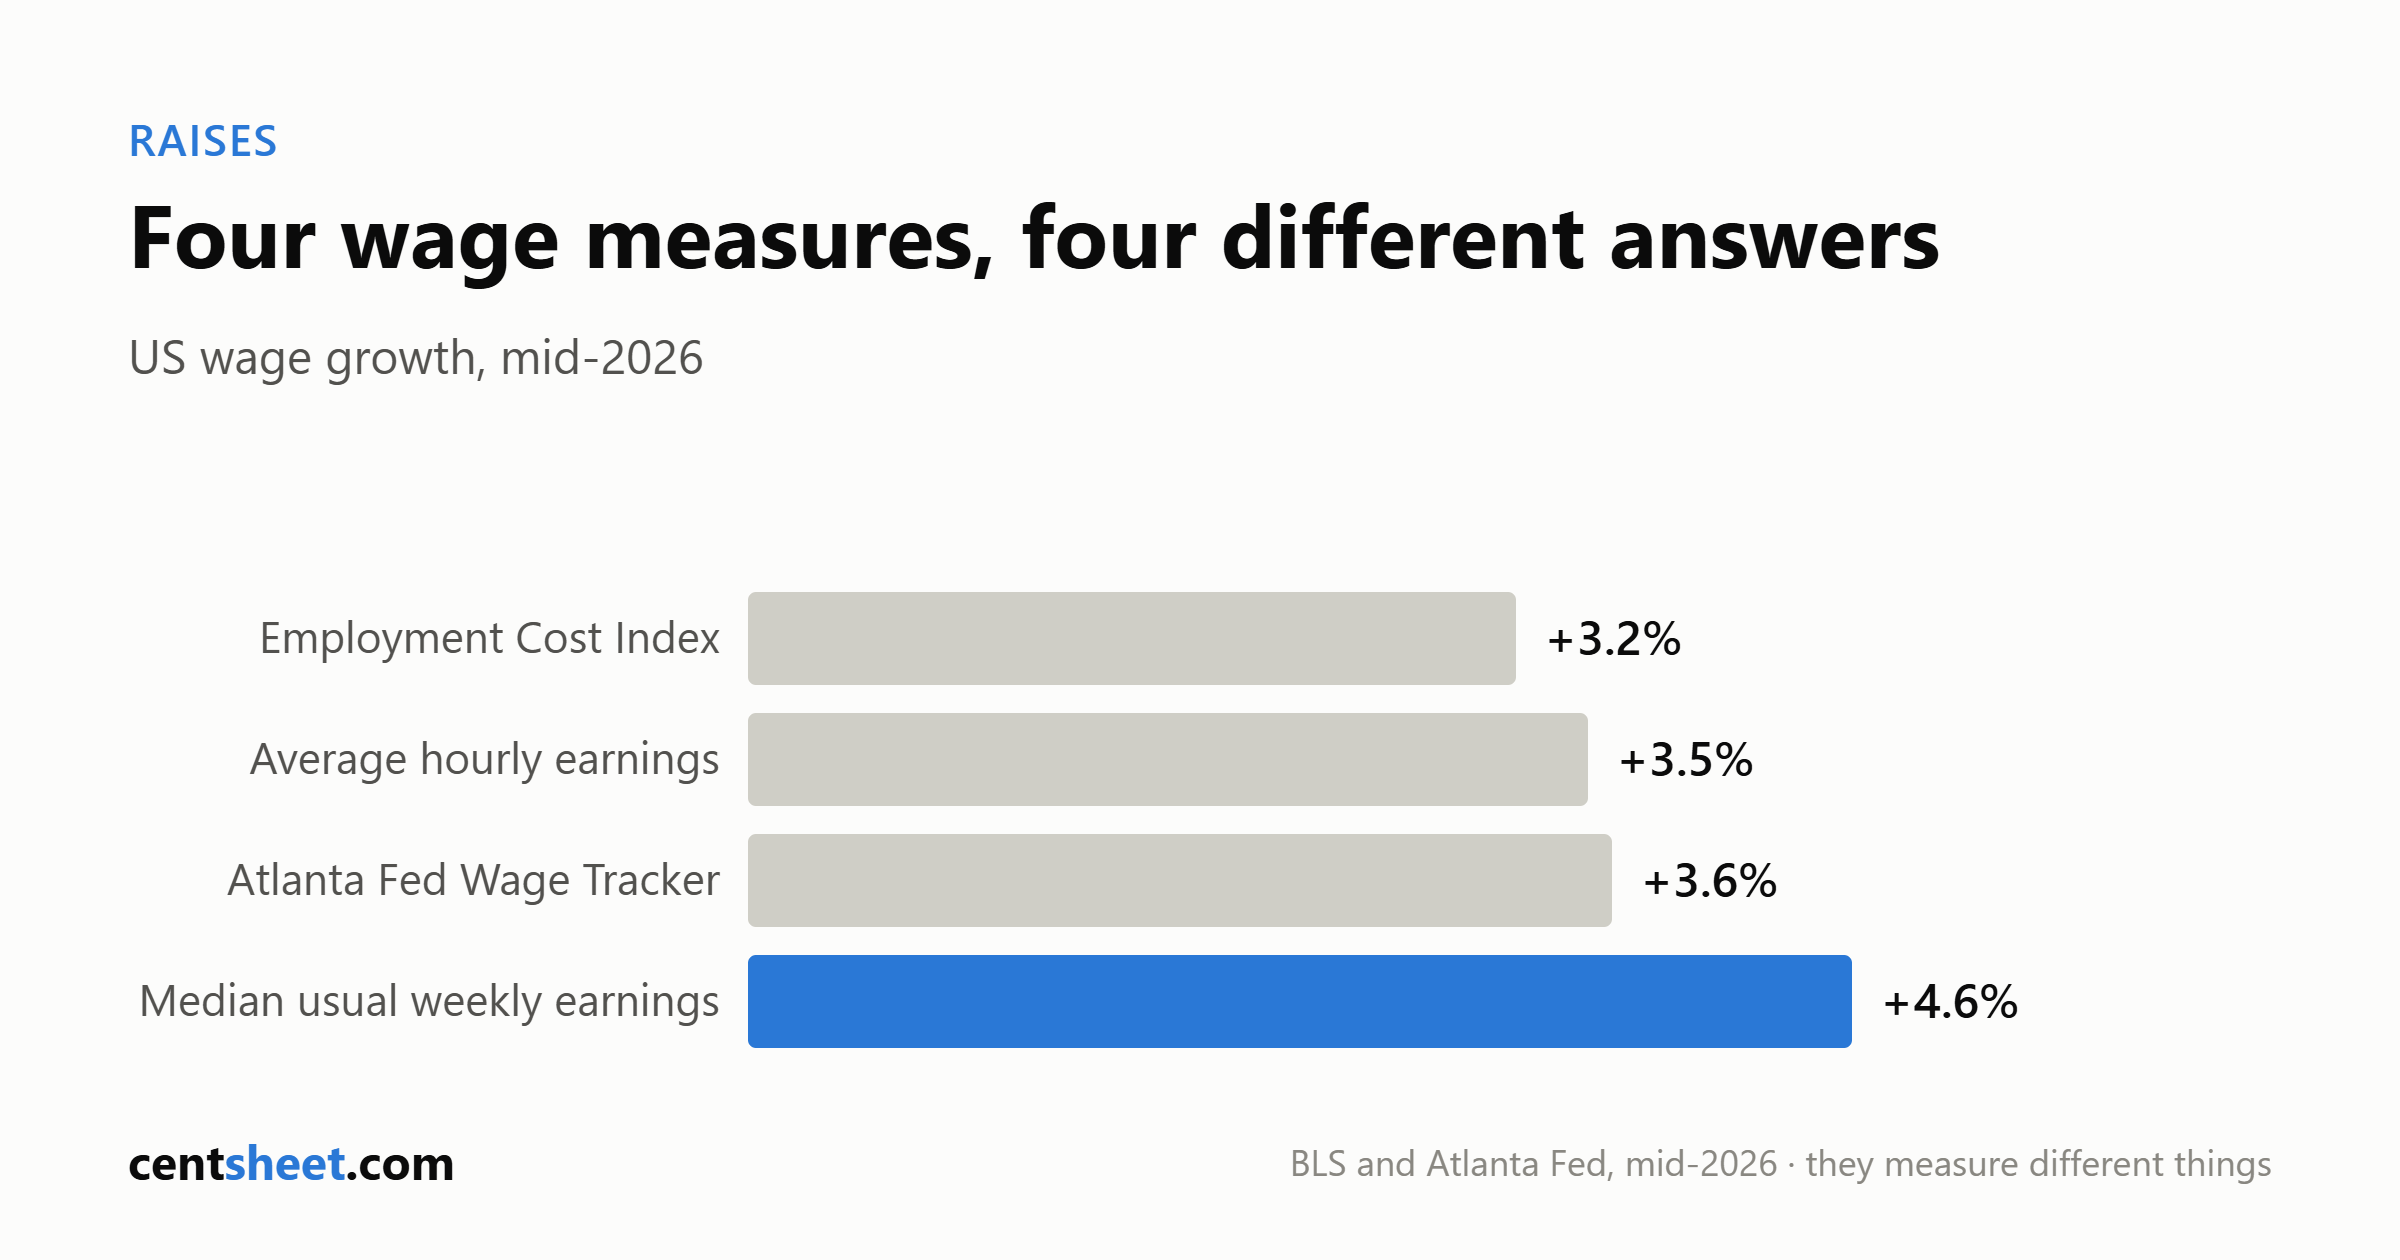
Four federal wage numbers, four different answers
There is no single “wage growth” figure. Four credible federal readings cover roughly the same moment.
| Measure | Latest reading | Reference period | What it actually measures |
|---|---|---|---|
| ECI, wages and salaries, civilian workers | +3.2% | 12 months ending June 2026 (NSA) | Fixed job mix; strips out who holds which job |
| Average hourly earnings, private nonfarm | +3.5% | June 2026 vs June 2025 | Payroll average; moves when the job mix moves |
| Atlanta Fed Wage Growth Tracker | +3.6% | June 2026, 3-month moving average | Median 12-month change for the same individuals |
| Median usual weekly earnings, full-time | +4.6% | Q2 2026 vs Q2 2025 | The median full-time worker’s usual weekly pay |
They measure different things; none of them is wrong. Pick the one that fits your claim, say which it is, and do not swap 3.2% for 4.6% mid-argument.
On levels: median usual weekly earnings across 120.9 million full-time workers were $1,251 in Q2 2026 (not seasonally adjusted), or $1,258 seasonally adjusted, up from $1,233 in Q1 2026. Average hourly earnings on private nonfarm payrolls were $37.64 in June 2026; production and nonsupervisory employees averaged $32.38.
Internal raises lag the market structurally
Your employer’s raise pool is set months in advance from a compensation survey and a finance target. The Employment Cost Index is the cleanest read on it, and civilian wages and salaries have been decelerating:
| 12 months ending | ECI wages and salaries, civilian workers |
|---|---|
| June 2025 | 3.6% |
| March 2026 | 3.4% |
| June 2026 | 3.2% |
Meanwhile the money your employer spends on you is going somewhere other than your paycheck. Over the 12 months ending June 2026, civilian total compensation rose 3.4% while benefits rose 3.8%. Private-industry health benefit costs rose 6.0% — the fastest-growing major component in the release, up from 5.8% in the 12 months ending June 2025 and 5.7% ending March 2026.
So when a manager says the budget is tight, that is often literally true at the compensation-cost level even though your cash pay barely moved. It is also why “we gave the team 3%” sits near the published average rather than above it.
On inflation, be precise, because the two obvious measures point different ways. Inflation-adjusted wages and salaries for private industry workers fell 0.4% over the 12 months ending June 2026, against a 3.1% current-dollar gain. In the separate median weekly earnings series, Q2 2026 earnings rose 4.6% year over year against a 3.9% gain in CPI-U. Different populations, different methods. “Wages beat inflation” is not a claim either supports alone.
The market you are negotiating into
Leverage in a raise conversation is mostly the credibility of your outside option, and that market was slow in mid-2026. Unemployment was 4.2% in June 2026, with 7.1 million unemployed, and nonfarm payrolls rose 57,000 that month. The long-term unemployed — 27 weeks or more — numbered 1.9 million, up 286,000 over the year, and were 27.3% of the total.
That is not a reason to skip the ask. It means the implied threat behind it is weaker than in a tight market. If your budget cannot absorb a gap between jobs, fix that first — see how much emergency fund you need and, if the monthly math is the binding constraint, getting out of the paycheck-to-paycheck cycle.
What the law lets them ask, and what it makes them show you
Pay transparency and salary history rules changed what a raise conversation can be built on. Three states, verified against a government source:
| State | Pay range disclosure | Salary history | Source |
|---|---|---|---|
| California | Employers with 15+ employees must include the pay scale in any job posting, since Jan 1, 2023 | Labor Code § 432.3 bars asking for salary history, since Jan 1, 2018 | CA DIR / DLSE |
| Washington | Employers with 15+ employees must post a wage scale or salary range, a general description of benefits, and other compensation such as bonuses, commissions, profit-sharing and stock options | Ban dated 7/28/2019 by a secondary tracker | WA L&I (posting rule) |
| Virginia | Ranges required in postings from July 1, 2026 | Wage-history inquiries banned from July 1, 2026, Va. Code § 40.1-28.7:12 | Virginia DOLI |
Washington’s L&I says a posted range must be the employer’s “most reasonable and genuinely expected compensation range” at time of posting.
Two limits. A salary history ban stops the employer asking; it does not stop you volunteering, and California’s DLSE says an employer may then consider what you disclosed. And nothing we read entitles you to see a coworker’s pay — these laws address ranges for positions.
Published counts of them are unreliable, so we are not printing one: the law-firm tracker we read, dated January 30, 2026, already predates Maine and Virginia, and higher totals in search summaries traced back to nothing we could fetch. A trade-press tracker updated April 28, 2026 identifies these states and territories as banning salary history questions by private employers: Alabama (9/1/2019), California (1/1/2018), Colorado (1/1/2021), Connecticut (1/1/2019), Delaware (12/14/2017), Hawaii (1/1/2019), Illinois (9/29/2019), Maine (9/17/2019), Maryland (10/1/2020), Massachusetts (7/1/2018), Minnesota (1/1/2024), Missouri (10/31/2019, employers with 6+ employees), Nevada (10/1/2021), New Jersey (1/1/2020), New York (1/6/2020), Oregon (10/6/2017), Puerto Rico (3/8/2017), Rhode Island (1/1/2023), Vermont (7/1/2018), Virginia (7/1/2026) and Washington (7/28/2019). Michigan (6/24/2018) and Wisconsin (4/18/2018) preempt local bans, so a city ordinance may not reach you. D.C.’s district-wide ban took effect June 30, 2024.
Maine’s posting law is the newest and we could not verify it primarily — statute URLs for 26 M.R.S.A. § 622-A returned 404. A law-firm analysis dated April 27, 2026 describes L.D. 54 as effective July 29, 2026 for employers with 10 or more employees, requiring a pay range in postings and, on request, the range for an employee’s own position.
What the research says about negotiating itself
The most current study we found is an NBER working paper issued June 2025 (revised July 2025) by Cullen, Pakzad-Hurson and Perez-Truglia, running two field experiments with more than 3,100 job seekers in U.S. tech. A light-touch encouragement intervention significantly increased both negotiation attempts and compensation gains. A substantial discount on negotiation coaching did not significantly affect whether people negotiated at all.
That second result is the one the coaching industry leaves off its landing page. The paper is not yet peer-reviewed and its abstract reports no effect size — so we cannot tell you what encouragement was worth in dollars, and neither can anyone quoting “$5,000” or “7% more” at you. The authors model negotiation as carrying risk. “Always negotiate” is not a finding.
Historical only: a 2010 NBER paper by Hall and Krueger found about one-third of respondents bargained before accepting their job, from roughly 5% of blue-collar workers to 86% of knowledge workers — data predating the pandemic labor market and every state transparency law.
Preparation, in the order that matters
The evidence file. Start it now, not the week before. Dated entries, each with a number where one exists: what you shipped, what it saved or earned, what you absorbed that nobody replaced, what your scope was at hire versus now. Managers advocate upward with artifacts, not adjectives.
The market range. Where postings must carry ranges, your employer’s own postings are the cleanest comparable available — same company, same leveling, published under legal obligation. Where disclosure on request is required, ask for the range for your position. Bring three to five ranges, not twenty.
The timing. Compensation pools are decided before they are announced. Ask when the cycle closes and be in the conversation a cycle ahead of it. The next Employment Cost Index release, covering September 2026, is scheduled for October 30, 2026 at 8:30 a.m. ET.
The specific ask. One number, stated out loud, with the range behind it. Not “a raise,” not “market rate,” not a hint. If the answer is no, the follow-up is what would have to be true and by when. A written scope-and-date answer is worth something; “we’ll revisit” is not.
The fallback list, ranked. Title, scope, a bonus target, remote days, a training budget, a review date in writing. Rank them beforehand so you are not improvising a concession under pressure. Our bill negotiation scripts cover the same posture with a different counterparty.
A scale illustration, not a prediction
CentSheet calculation. Median usual weekly earnings of $1,251 (Q2 2026, not seasonally adjusted) annualize to $65,052 at 52 weeks. The two June 2026 Atlanta Fed readings applied to that give $2,212 at 3.4% and $2,667 at 4.1% — a gap of $455 over one year. Assumptions: 52 paid weeks, no bonus, no benefits change, hourly-wage percentages applied to an annual salary they were not built to describe. Not a forecast; nothing here supports predicting 2027 wage growth.
What to actually do
1. Write down which wage measure you are quoting and its reference period. ECI wages and salaries +3.2% (12 months to June 2026) is the peg for raise pools; the 4.1% versus 3.4% switcher gap is the peg for what leaving pays. Not interchangeable. 2. Look up your state and city rules at the agency site, not a tracker. If ranges must be posted, pull your employer’s postings. 3. Build the evidence file over a quarter, not a weekend. 4. Ask when the compensation cycle closes, then schedule the conversation a cycle ahead of it. 5. Name one number, backed by three to five real ranges. Do not lead with a range of your own. 6. If the answer is no, get the conditions and a date in writing. Treat a vague “revisit later” as a no. 7. Do not budget on an unapproved raise, and do not treat quitting as the fallback unless you can absorb a gap — 1.9 million people were unemployed 27 weeks or longer in June 2026. 8. Skip paid negotiation coaching until someone shows you an effect size. In the one current experiment we found, a subsidized-coaching offer did not significantly move whether people negotiated.
CentSheet publishes educational content, not personalized financial advice, and nothing here is legal advice — verify any state or local pay law with the relevant government agency.
Get the CentSheet Money Brief
Email me CentSheet weekly: practical money decisions, new calculators, and useful worksheets. Unsubscribe anytime.