The EPA’s most recent estimate puts the cost of the food an American consumer throws away at $728 per person per year — about $14 a week, roughly 11 percent of what that consumer spends on food at home and out. That comes from an April 2025 EPA report, and it is the largest grocery-savings lever here with a federal dollar figure attached.
Here is the awkward part. There is no primary-source figure for how much coupons save, how much meal planning saves, or how much cheaper store brands are. We looked. Everything traced back to a retailer, a coupon site, or content marketing. So this article ranks the levers by the size of the spending they touch, and says where the data runs out.
What US households actually spend on food
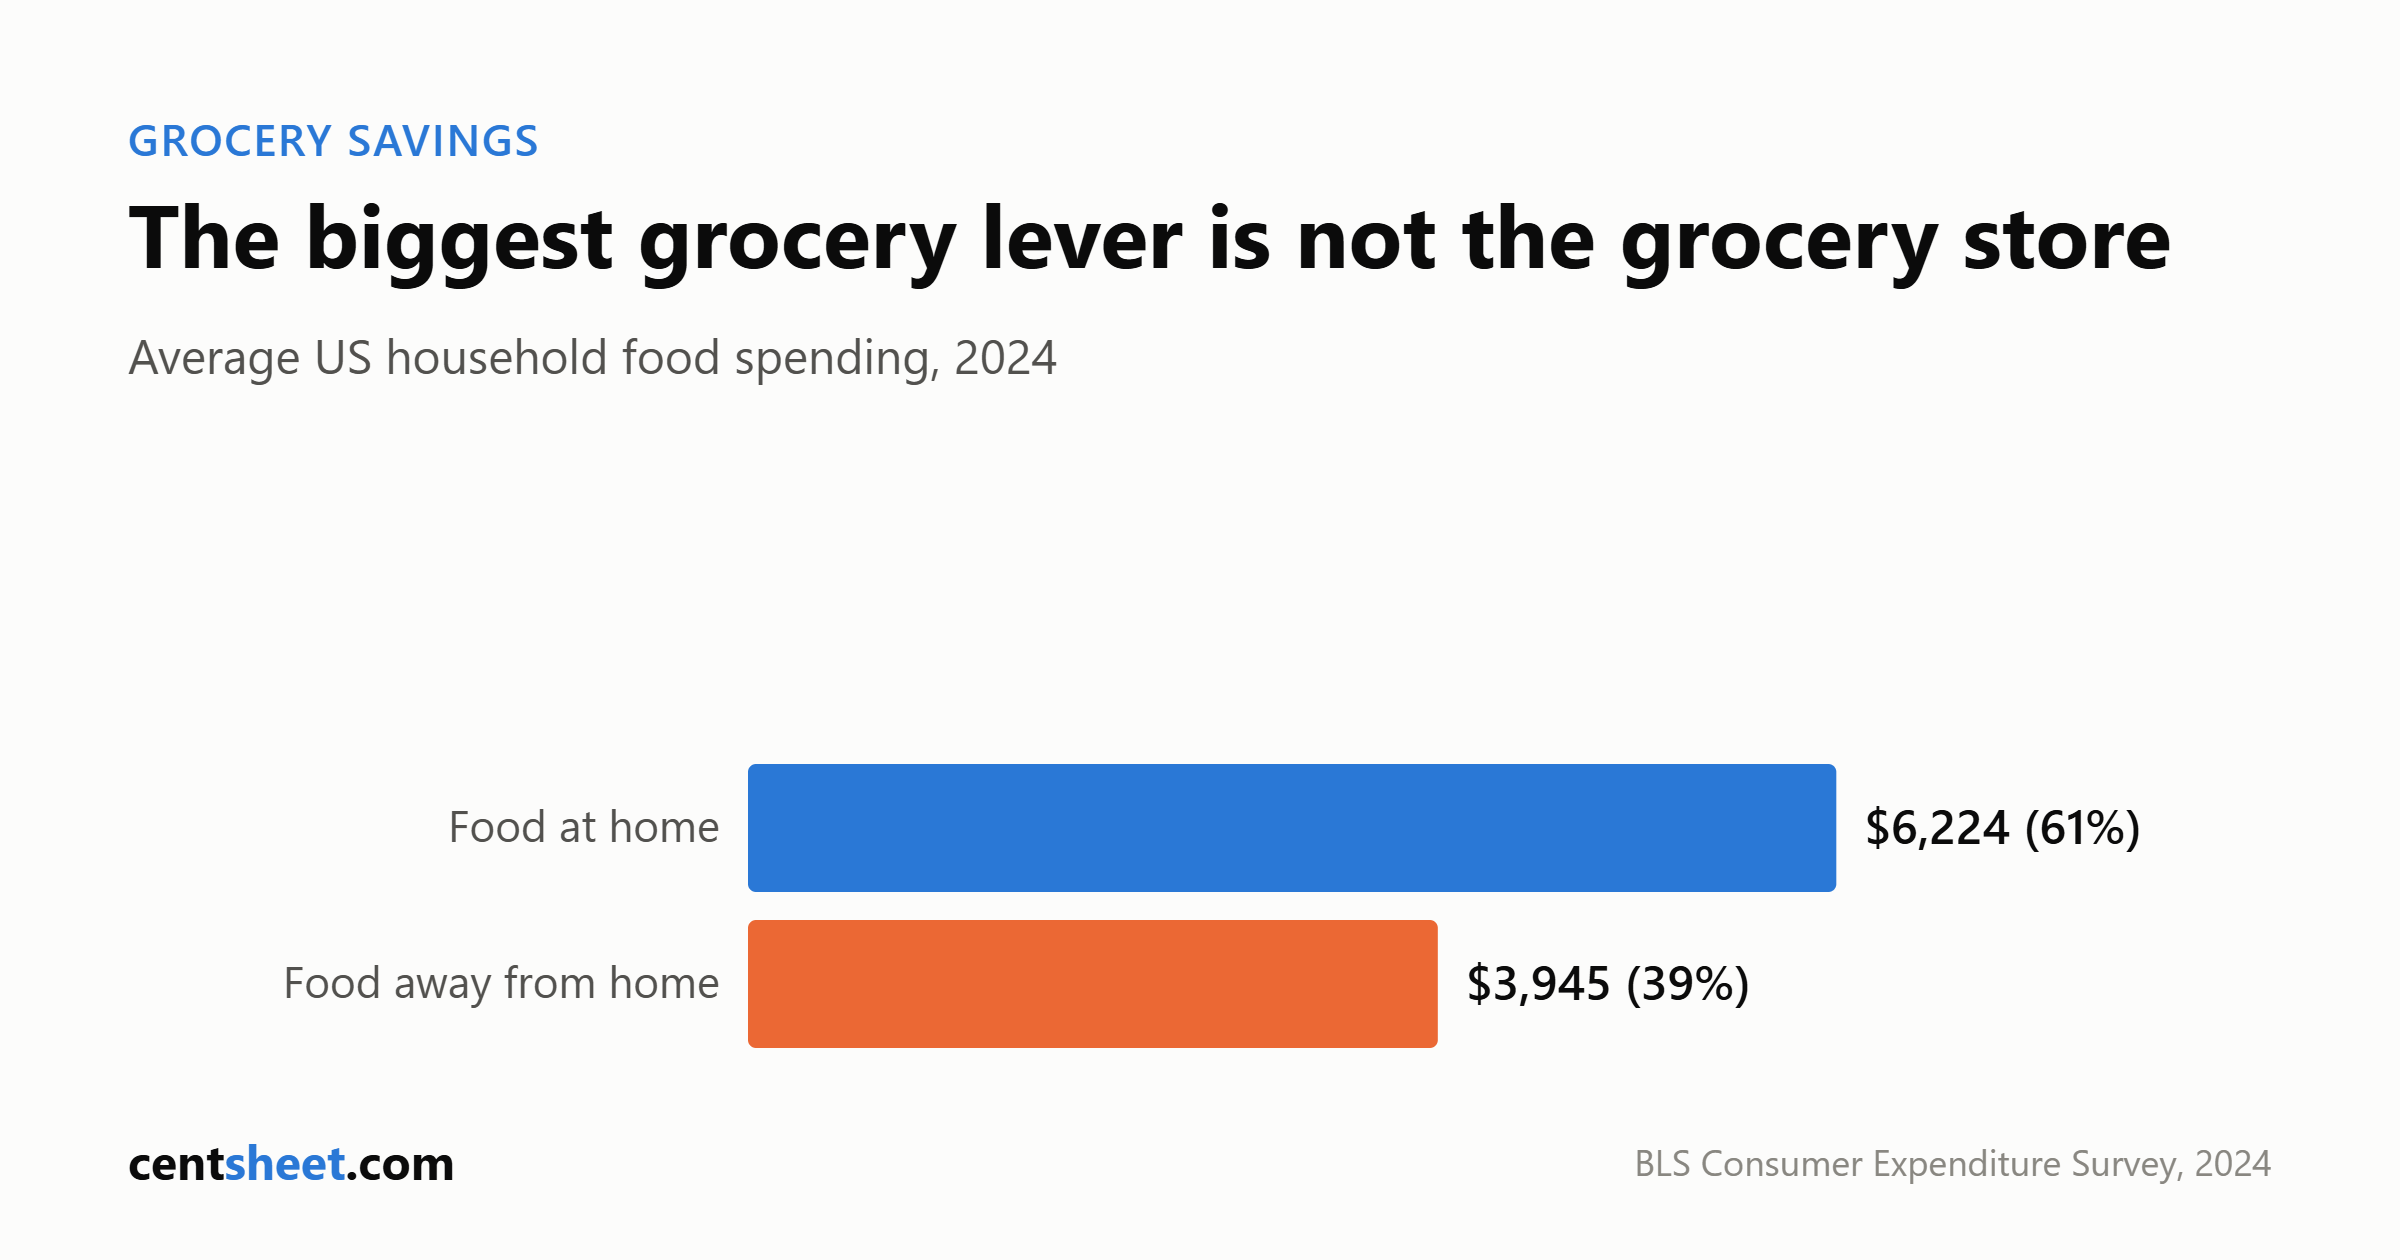
The Bureau of Labor Statistics Consumer Expenditure Survey is the closest thing to a household-level number. For 2024, the most recent year published (released December 19, 2025):
| Food category | Mean per consumer unit, 2024 | Share of food spending |
|---|---|---|
| Food at home | $6,224 | 61% |
| Food away from home | $3,945 | 39% |
| Total food | $10,169 | 100% |
The shares are our arithmetic on the BLS dollar figures. Two caveats matter more than the numbers. These are means, not medians — BLS publishes no median here, and a mean is pulled upward by heavy spenders. And a “consumer unit” averages 2.4 people, so this is not a family-of-four grocery bill.
Food was 12.9 percent of total household expenditures in 2024 — a share of what households spent, not what they earned. BLS published no after-tax income estimates for 2024 at all: the external tax model it relies on was not updated.
The split by income is the interesting part. Food at home falls steadily as a share of total spending — 11.0 percent in the lowest income quintile, 6.2 percent in the highest. Food away from home is nearly flat: 4.7, 4.9, 4.9, 5.2 and 5.1 percent across the five quintiles. In share terms, restaurant and takeout spending is not a high-income behavior.
The two federal sources point in opposite directions
BLS says households spend more on groceries than on restaurants: $6,224 versus $3,945. USDA’s Economic Research Service says the opposite — total US food expenditures in 2025 were $2.51 trillion, of which $1.41 trillion went to food away from home and $1.10 trillion to food at home.
Both are correct, and the reason is the universe. The ERS series counts everyone: households, government purchases through SNAP and school meals, business and employer-provided meals, home production and donations, with and without sales taxes and tips. BLS counts self-reported household out-of-pocket spending only. “Americans now spend more on restaurants than groceries” is the ERS series, and it is not a statement about your household.
ERS also gives a long-run ratio: US consumers spent 9.7 percent of disposable personal income on food in 2025 — 4.8 percent at home, 4.9 percent away. In 1997 it was 10.4 percent total, but 6.1 at home and 4.3 away. The total barely moved. The mix flipped. These are aggregate ratios, not household averages.
The USDA benchmark, and what it is not
USDA publishes four food plans monthly — Thrifty, Low-Cost, Moderate-Cost and Liberal — each a nutritionally adequate market basket priced to a US average. As of May 2026 (issued June 2026, the latest month published):
| USDA food plan | Monthly cost, family of four | Where the number comes from |
|---|---|---|
| Thrifty | $1,018.20 | USDA-published Reference Family total |
| Low-Cost | $1,122.00 | CentSheet sum of four individual costs |
| Moderate-Cost | $1,386.70 | CentSheet sum of four individual costs |
| Liberal | $1,675.30 | CentSheet sum of four individual costs |
The Thrifty figure is USDA’s own, for the Reference Family defined in the Food and Nutrition Act of 2008 — two adults aged 20 to 50, a child 6 to 8 and a child 9 to 11 — at $235.00 per week. The other three rows are ours. USDA publishes a family-of-four total for the Thrifty plan only; the other three appear in a separate report listing per-individual costs and no family totals. We summed the four matching individuals (male 19-50, female 19-50, child 6-8, child 9-11) at each level. A four-person household takes no size adjustment under USDA’s rules; one person adds 20 percent, two adds 10, three adds 5, five or six subtracts 5, seven or more subtracts 10.
Third-party sites circulate family-of-four numbers for these plans — around $1,347 a month for Moderate-Cost is one we saw. USDA publishes no such total, our sum comes out higher, and different sites use different age brackets. Treat all of them, ours included, as arithmetic rather than official figures.
Three limits on these plans, all of them USDA’s own footnotes:
- Every plan assumes all meals and snacks are prepared at home. No restaurants, no takeout, no coffee out. They are nutrition-adequacy targets, not observed behavior.
- The baskets are old. Low-Cost, Moderate-Cost and Liberal rest on 2001-02 consumption data with 2005-era dietary guidance; Thrifty rests on 2013-16 consumption and 2015-16 prices. Only the price adjustment is current — USDA reindexes monthly against CPI.
- They are republished every month. A USDA food plan figure without a month attached is not a fact.
Used honestly they remain the best public benchmark available. Our grocery budget math piece fits them to your household, and the grocery budget calculator does the size adjustment.
The levers, ranked
| Lever | Sourced size | What it rests on |
|---|---|---|
| Food away from home | $3,945 mean per consumer unit, 2024 | BLS CE 2024 — 39% of all food spending |
| Food thrown away | $728 per person per year | EPA, April 2025 — about 11% of food spending |
| Which basket you buy | $553.30/month between Low-Cost and Liberal, family of four | Our sum of USDA May 2026 figures |
| Coupons, apps, store-brand switching | No primary-source figure exists | — |
1. The away-from-home line
At a 2024 mean of $3,945 per consumer unit, food away from home is 39 percent of household food spending by our arithmetic — roughly $329 a month. Unlike the grocery line, it has no nutritional floor under it. That is a statement about size, not a prescription: takeout buys time, and time has a price. But if you have not looked at this line, you are optimizing the smaller half.
2. Waste
EPA estimates 256 pounds of purchased food wasted per person per year, at $728 — about 11 percent of consumer food expenditures. For a household of four, EPA gives $2,913 a year, or $56 a week, but flags it as the per-capita number multiplied by four, and notes evidence that per-capita waste generally decreases as household size rises. That figure therefore probably overstates a real household of four.
Three caveats on that estimate:
- It rests on 2023 retail prices and USDA availability data through 2023. Prices have moved since.
- EPA excluded rice entirely, because USDA has not updated rice in its availability series since 2010. EPA says this biases the estimate low.
- It replaced an older figure of roughly $1,500 per household of four, from a 2014 USDA analysis built on 2010 prices. EPA says explicitly that the new number supersedes it. The old one is still everywhere online.
You will also see “40 percent of US food is wasted” and “66 million tons.” EPA’s report says over one-third is never eaten; the 40 percent claim traces to a 2012 advocacy paper we did not verify; the 66 million tons is a 2019 tonnage figure covering retail, food service and residential together. Three measures, three vintages, no corroboration.
3. What goes in the cart
USDA’s plans size this lever without anyone inventing a price comparison. For an adult male 19-50 in May 2026, the same nutritional adequacy costs $316.00 a month at the Low-Cost level and $484.60 at the Liberal level. Across our family-of-four sums, Low-Cost to Liberal is $553.30 a month; Thrifty to Liberal is $657.10. That spread is composition — cuts of meat, convenience level, brand tier — and it is where the “buy cheaper protein” advice actually lives. We cannot tell you what a specific swap saves, because no primary source publishes it.
4. Coupons and apps
We could not verify a single figure for what coupon clipping, app stacking, cash-back rewards or store-brand switching returns per hour spent. Not one. The organizations publishing estimates are the ones selling coupons, apps or groceries.
That is not proof the savings are zero. It is a reason to cap the time. The three levers above are measured in hundreds of dollars a month; this one is not measured at all, and does not deserve first position in your week.
When the number is the number
The FY2026 maximum SNAP allotment is $994 a month for a four-person household in the 48 states and DC, and $298 for one person, effective October 1, 2025 through September 30, 2026. USDA sets it from the Thrifty Food Plan cost each June. The May 2026 Thrifty cost for the reference family is $1,018.20 — $24.20 above the current maximum, by our subtraction. That gap is what a year of food-price inflation looks like inside a benefit that resets annually.
USDA also reported 13.7 percent of US households — 18.3 million — food insecure in 2024, 5.4 percent at very low food security. If your grocery spending is already at or below the Thrifty level and still does not work, the problem is the price level, not your shopping technique. No amount of list-making closes a gap like that.
What to actually do
1. Measure one month, split two ways. Groceries and food away from home, separately. Almost nobody knows their own split, and it determines which lever matters. The grocery budget calculator gives you a per-household target to compare against. 2. Pick a USDA plan level and size it to your household. Sum the individual costs for your actual ages, then apply the size adjustment (+20 percent for one person, +10 for two, +5 for three, −5 for five or six). It assumes every meal is cooked at home, so it is a ceiling only if you eat that way. 3. Look at the away-from-home line first if it is running near or above a third of your food spending. It is the biggest number with the least structure holding it in place. 4. Track what you bin for two weeks. Not as a moral exercise — as measurement. EPA’s estimate is about 11 percent of food spending, the second-largest sourced lever here. 5. Move plan level, not item by item. Low-Cost to Liberal for a family of four is $553.30 a month in USDA’s May 2026 figures — mostly composition and convenience. 6. Give coupons and cash-back apps a fixed weekly time budget and stop when it expires. Nobody publishes a verified return per hour for this, which is itself informative. 7. Test the grocery line against the whole budget. Food was 12.9 percent of total household expenditures in 2024, against 33.4 percent for housing and 17.0 percent for transportation. Our 50/30/20 stress test and the budget calculator put it in proportion.
The short version: the money is in restaurants, waste, and which basket you buy — in that order, as far as the public data can tell. Everything else is unmeasured, and the people who would measure it for you have a commercial reason not to.
CentSheet publishes educational content, not personalized financial advice.
Get the CentSheet Money Brief
Email me CentSheet weekly: practical money decisions, new calculators, and useful worksheets. Unsubscribe anytime.