In 2024 the lowest-income fifth of US households put 41.6 percent of everything they spent into housing. The top fifth put 29.3 percent. Same survey, same year, same definition. That 12.3-point gap is wider than the entertainment, apparel, education and alcohol lines combined, which came to 9.9 percent of spending at the all-household average — our sum of the Bureau of Labor Statistics shares.
A percentage target that fits a household at $265,000 cannot fit one at $17,000, and the difference is not discipline.
Where 50/30/20 came from, and what we could not verify
The 50/30/20 split — 50 percent to needs, 30 to wants, 20 to savings and debt paydown — traces to All Your Worth: The Ultimate Lifetime Money Plan by Elizabeth Warren and Amelia Warren Tyagi, published 2005 by Free Press, where it appears as the Balanced Money Formula. We verified authors, publisher and year from the Open Library catalog record. We could not access the book text: the publisher’s site returned an access error and the Google Books API rate-limited us. So we cannot quote it, and we cannot confirm from the source what it counts as a “must-have” or whether it specifies after-tax income as the denominator — even though nearly every write-up of the rule asserts that it does.
Sources also split on whether the authors invented the rule or popularized an existing one. We found nothing published before 2005 setting out a 50/30/20 split, but we could not read the book to see what it says about its own origins, so “popularized by” is the defensible phrasing. And there is no peer-reviewed or government-published critique of the rule at all. Everything our search returned was bank, credit-union, brokerage or SEO blog content, all of it selling something adjacent to a budgeting product. The case below is built from federal statistics, not from “experts say.”
Nobody publishes the number you would need to check yourself
To know how real households stack up against 50/30/20, you need spending by category as a share of after-tax income. That number does not currently exist. BLS published no after-tax income estimates for 2024 at all: per its own methodology note, the provider of the external tax-estimation model it uses did not update the model for tax year 2024, so there are no federal or state tax estimates and no after-tax income in the 2024 tables, in LABSTAT, or in the public use microdata.
Every category share below is therefore a share of total expenditures — not of income, and not of after-tax income. Lining those up against 50/30/20 as though they shared a denominator is invalid arithmetic. Anyone showing you a chart of “how Americans really do against 50/30/20” from 2024 CE data has quietly swapped denominators.
What US households actually spend
BLS Consumer Expenditure Survey, 2024, all consumer units. These are means, not medians — the published tables contain no median, and the average consumer unit is 2.4 people. Means are pulled up by high spenders, so the typical household spends less than these dollar figures on most lines.
| Category | Share of total spending, 2024 | Mean dollars, 2024 |
|---|---|---|
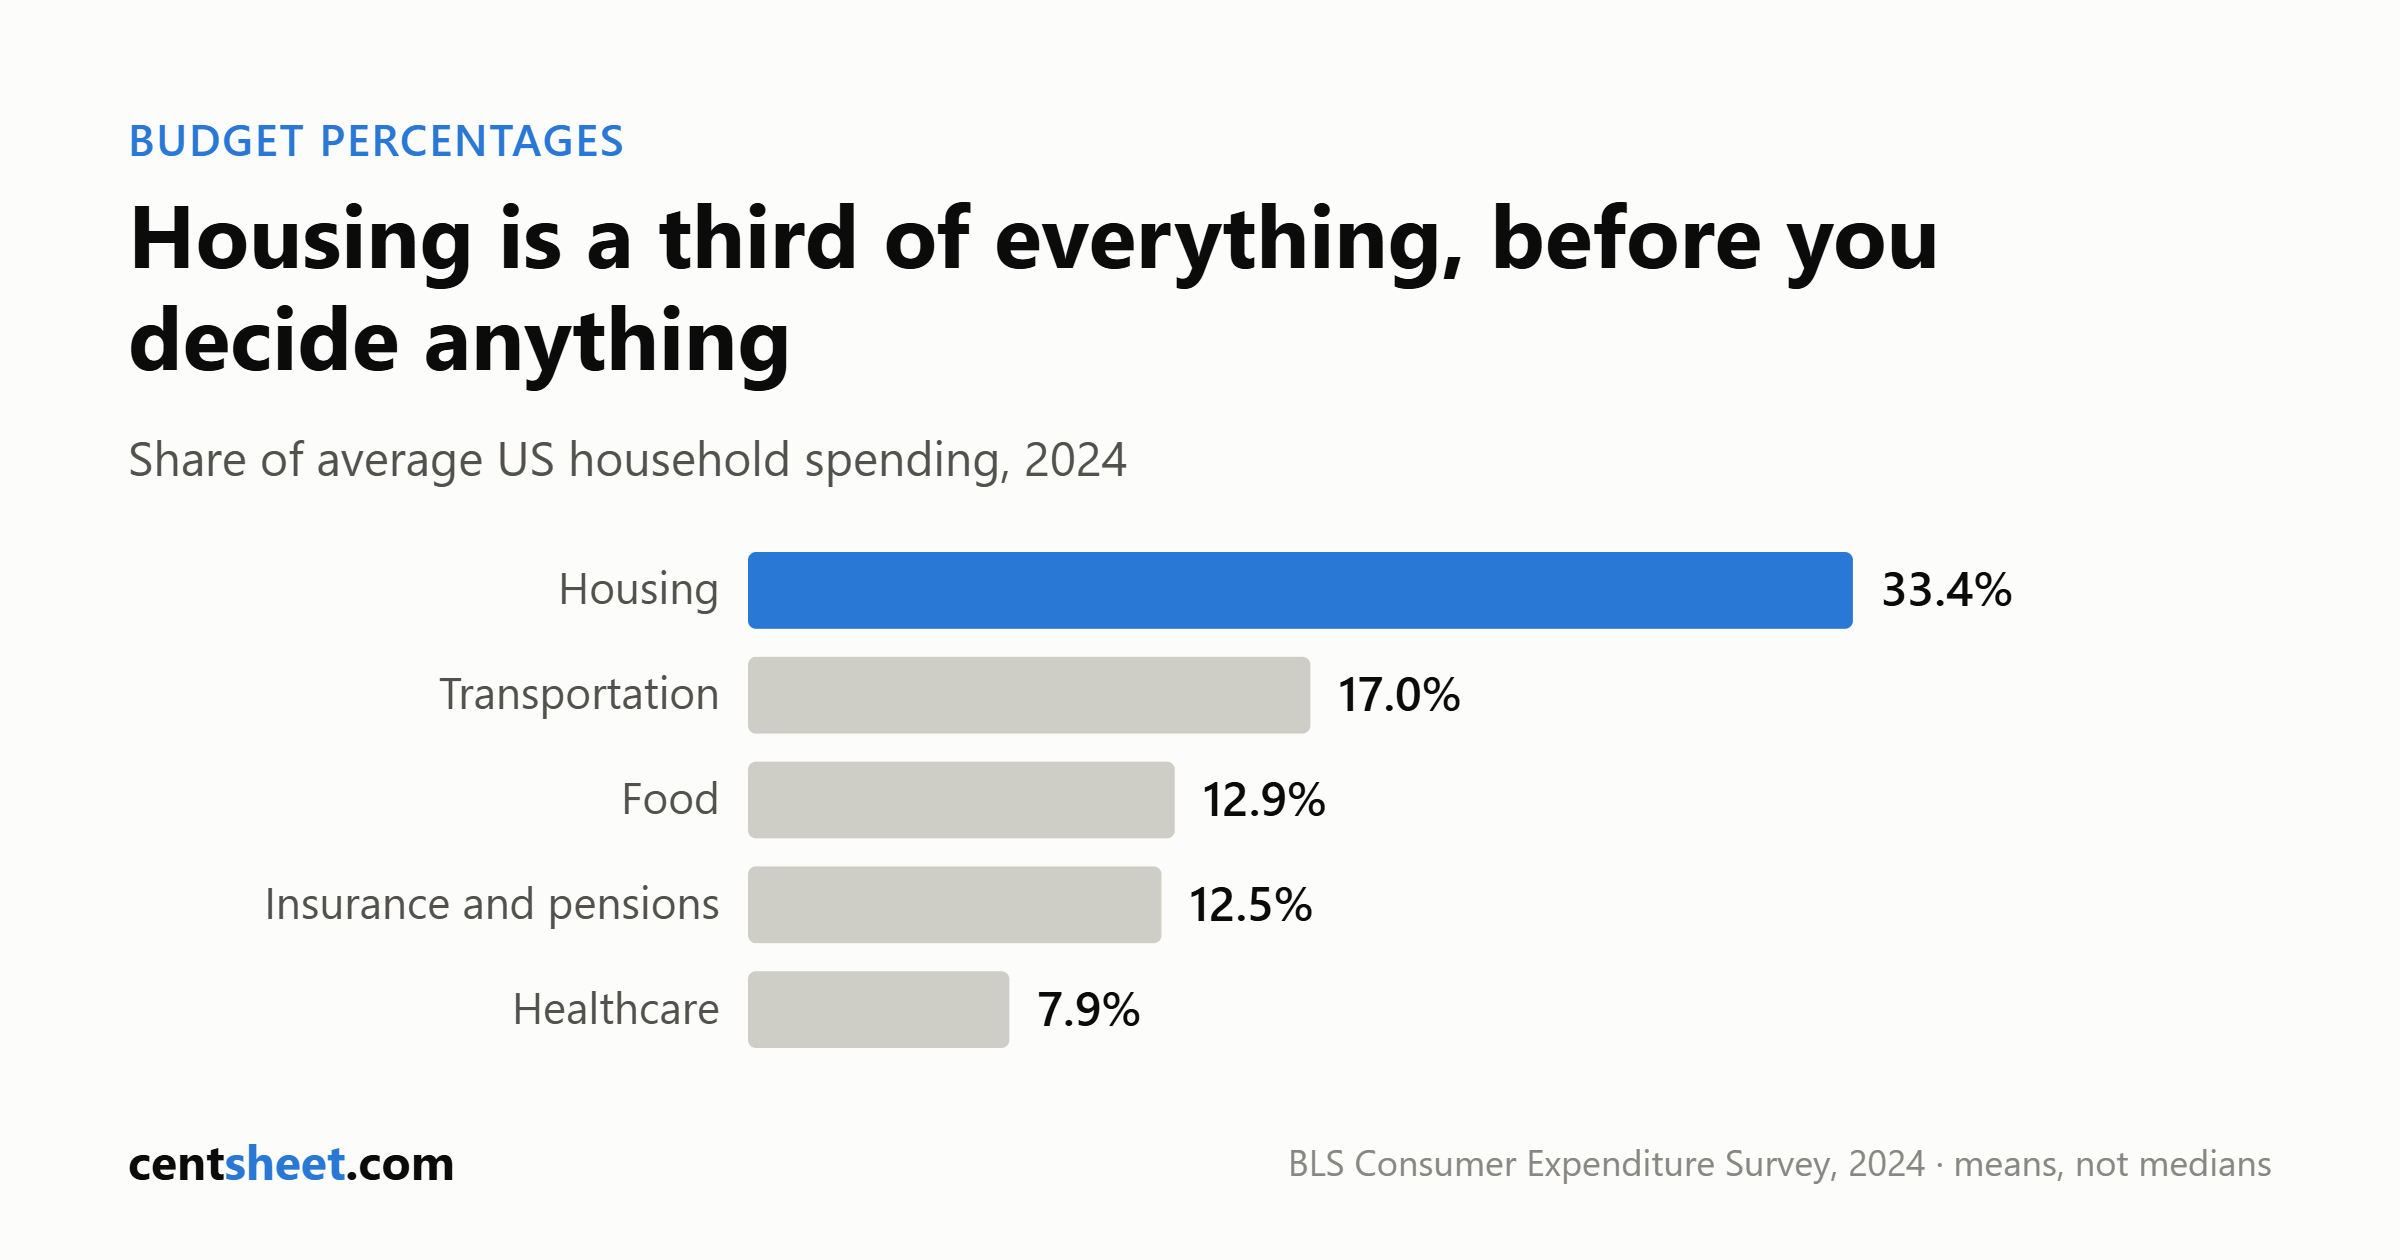
| Housing | 33.4% | $26,266 (shelter $16,317) |
| Transportation | 17.0% | $13,318 |
| Food | 12.9% | $10,169 (at home $6,224, away $3,945) |
| Personal insurance and pensions | 12.5% | $9,797 (retirement, pensions, Social Security $9,222) |
| Healthcare | 7.9% | $6,197 (health insurance $4,055) |
| Entertainment | 4.6% | — |
| Cash contributions | 2.9% | — |
| Apparel and services | 2.5% | — |
| Education | 2.0% | — |
| Alcoholic beverages | 0.8% | — |
Mean annual expenditures were $78,535; mean income before taxes was $104,207. BLS notes the shares do not sum to 100.0 because of rounding.
A warning on the food line, where two federal agencies point opposite ways. BLS, measuring self-reported household out-of-pocket spending in 2024, has groceries ahead of restaurants: $6,224 versus $3,945. USDA’s Economic Research Service, measuring total US food expenditures in 2025, has it reversed: $1.41 trillion away from home versus $1.10 trillion at home. ERS is not a household measure — it counts government purchases through food assistance and school meals, business and employer-provided meals, home production and donations, with and without sales taxes and tips. ERS also puts food at 9.7 percent of disposable personal income in 2025 (4.8 at home, 4.9 away), again an economy-wide ratio. Use one or the other with its universe stated. Do not blend them.
The housing line dominates everything else
Split the same survey by income quintile and the case for one universal percentage collapses. The 2024 quintile lower bounds: $29,932 for the second fifth, $57,452 the third, $94,511 the fourth, $155,925 the highest, across roughly 136 million consumer units.
| Income quintile, 2024 | Mean pre-tax income | Mean expenditures | Housing share | Transport | Healthcare | Personal insurance & pensions |
|---|---|---|---|---|---|---|
| Lowest | $16,658 | $35,046 | 41.6% | 14.6% | 9.8% | 2.0% |
| Second | $42,925 | $50,054 | 38.3% | 16.8% | 9.6% | 5.4% |
| Third | $74,474 | $66,900 | 36.0% | 17.4% | 8.5% | 9.3% |
| Fourth | $121,548 | $89,972 | 32.6% | 17.7% | 8.1% | 13.3% |
| Highest | $264,510 | $150,342 | 29.3% | 16.9% | 6.5% | 18.1% |
| All units | $104,207 | $78,535 | 33.4% | 17.0% | 7.9% | 12.5% |
Shelter alone runs 26.2 percent of spending in the lowest fifth against 18.2 percent in the highest, and food at home 11.0 percent against 6.2 percent. Food away from home is almost flat across the distribution — 4.7, 4.9, 4.9, 5.2 and 5.1 percent from bottom to top. The line most often blamed for broken budgets barely varies by income. Housing varies enormously.
Two rows need reading carefully. The lowest quintile’s mean expenditures ($35,046) exceed its mean reported pre-tax income ($16,658) by more than double — a long-documented feature of this survey arising from income underreporting, non-cash transfers, asset drawdown, borrowing, irregular income and retirees spending down savings. BLS does not endorse reading it as overspending, and neither do we. And the 2.0 percent “personal insurance and pensions” figure is not a savings rate: that category bundles mandatory Social Security payroll deductions and life insurance premiums with voluntary retirement contributions, and at the bottom it is close to entirely payroll tax. “The poorest fifth save 2 percent” is a sentence the data does not support.
Our arithmetic on the extremes, share multiplied by that quintile’s mean expenditure: roughly $14,600 of housing a year in the lowest fifth, roughly $44,000 in the highest. The bottom fifth commits a far larger share to buy far less shelter. A percentage rule reads that as a budgeting failure. It is a price.
Where a single rule breaks
At low incomes. If housing takes 41.6 percent of what you spend, a 50 percent “needs” bucket is gone before food, transport, health insurance or utilities. Healthcare takes 9.8 percent in the bottom fifth against 6.5 percent at the top, so the squeeze compounds. No arrangement of the remaining categories produces a 20 percent savings line, and telling someone to find one is not advice. Our 50/30/20 stress test walks the same failure with worked examples.
At high housing costs, at any income. HUD’s thresholds are the anchor: a household is cost-burdened when monthly housing costs including utilities exceed 30 percent of monthly income, severely cost-burdened above 50 percent. HUD measures that on income while every BLS share above is measured on expenditures, so do not mix them — but the direction is unambiguous. Cross HUD’s 30 percent line and the “needs” half of any 50/30/20-style rule is mostly spoken for by one bill. See the true cost of an apartment for what else rides along with it.
You will also see it claimed that the rule was calibrated to 2005 housing costs and that rents have since risen some specific amount in real terms. We could not verify that from a primary source, so we are not making the claim.
What the savings line looks like in practice
The Federal Reserve’s Survey of Household Economics and Decisionmaking, fielded 17-28 October 2025 and published May 2026, is the closest thing to a report card on whether the savings percentage happens at all.
| SHED 2025 measure | All adults | Under $25k | $25k-$50k | $50k-$100k | $100k+ |
|---|---|---|---|---|---|
| Always or often had money left over at month end | 41% | 19% | 26% | 38% | 59% |
| Had a rainy day fund covering three months | 55% | 21% | 39% | 55% | 75% |
| Doing okay or living comfortably | 73% | 45% | 55% | 74% | 91% |
Those are income brackets, not quintiles, and they are not interchangeable with the BLS rows above.
On the much-quoted emergency question: 63 percent of adults said they would cover a hypothetical $400 expense exclusively with cash, savings, or a credit card paid off at the next statement, unchanged from the prior several years. The other 37 percent would use some other method, such as carrying a balance or borrowing; only 12 percent said they could not pay it by any means. The familiar “four in ten Americans can’t afford a $400 emergency” line misstates what the Fed measured. For sizing your own buffer, how much emergency fund you need beats any percentage.
Macro context on the 20 percent target: BEA put the national personal saving rate at 2.7 percent in June 2026, $646.1 billion, released 30 July 2026. That is total personal saving over total disposable personal income for the whole economy — an aggregate dominated by high-income households, not a household mean and certainly not a median. It cannot tell you what your neighbor saves. It can tell you the 20 percent norm sits a long way from the aggregate.
The two frames that survive contact with the data
Pay yourself first. Set the savings transfer as a dollar amount, automatic, on payday, and let the percentages fall out as a report card rather than a target. That inverts the failure mode of 50/30/20, where savings is the residual and so absorbs every surprise. Where the money sits is worth five minutes: the FDIC national average as of 20 July 2026 was 0.38 percent for savings accounts and 0.65 percent for money market accounts, so a default account earns approximately nothing. We name no banks or products, and no federal source supports a specific dollar gain from switching. Where to park cash covers the account types.
Fixed versus flexible, not needs versus wants. Needs and wants are moral categories and they invite argument; fixed and flexible are operational. At the all-household mean in 2024, housing, transportation, healthcare, and personal insurance and pensions came to 70.8 percent of total spending — our sum of the four published BLS shares. Food adds 12.9 percent, most of it not genuinely optional. What remains is the part a budgeting app can influence, and it is small. That argues for zero-based budgeting on the flexible portion and a structural decision on the fixed portion.
What to actually do
1. Compute your own percentages once, from three months of statements, using take-home pay as the denominator and writing that denominator down. Our budget calculator does the split; the point is the diagnosis, not the target. 2. Read the housing line first and treat it as the answer. Against HUD’s thresholds — over 30 percent of monthly income including utilities is cost-burdened, over 50 percent severely so — no discipline in the other categories closes the gap. The fix is the housing decision or the income, and both take months. 3. Do not benchmark yourself against BLS category shares. They are shares of total expenditures, and BLS published no after-tax income for 2024, so the apples-to-apples comparison does not currently exist. 4. Split fixed from flexible instead of needs from wants, then budget only the flexible part in detail. 5. Set the savings figure in dollars and automate it before anything else clears. A percentage that is whatever is left at month end is not a plan; 41 percent of adults told the Fed they always or often had money left over in the 2025 survey. 6. Recheck once a year, or whenever housing or income changes. Nothing else moves the percentages enough to matter.
Percentages are a diagnostic. They tell you where the money went, which is genuinely useful once a year. As a target they fail exactly where budgets are hardest — at low incomes and in expensive housing markets — and the industry that promotes them has never had to publish a number showing they work.
CentSheet publishes educational content, not personalized financial advice.
Get the CentSheet Money Brief
Email me CentSheet weekly: practical money decisions, new calculators, and useful worksheets. Unsubscribe anytime.