Nineteen percent of adults in families earning less than $25,000 said they always or often had money left over at the end of the month. Among adults in families earning $100,000 or more, 59 percent said the same. Both figures come from the Federal Reserve’s Survey of Household Economics and Decisionmaking, fielded October 17-28, 2025 and published in May 2026.
That gap is the subject here. Most saving advice is written as though technique closes it.
Where the money goes at the bottom of the income distribution
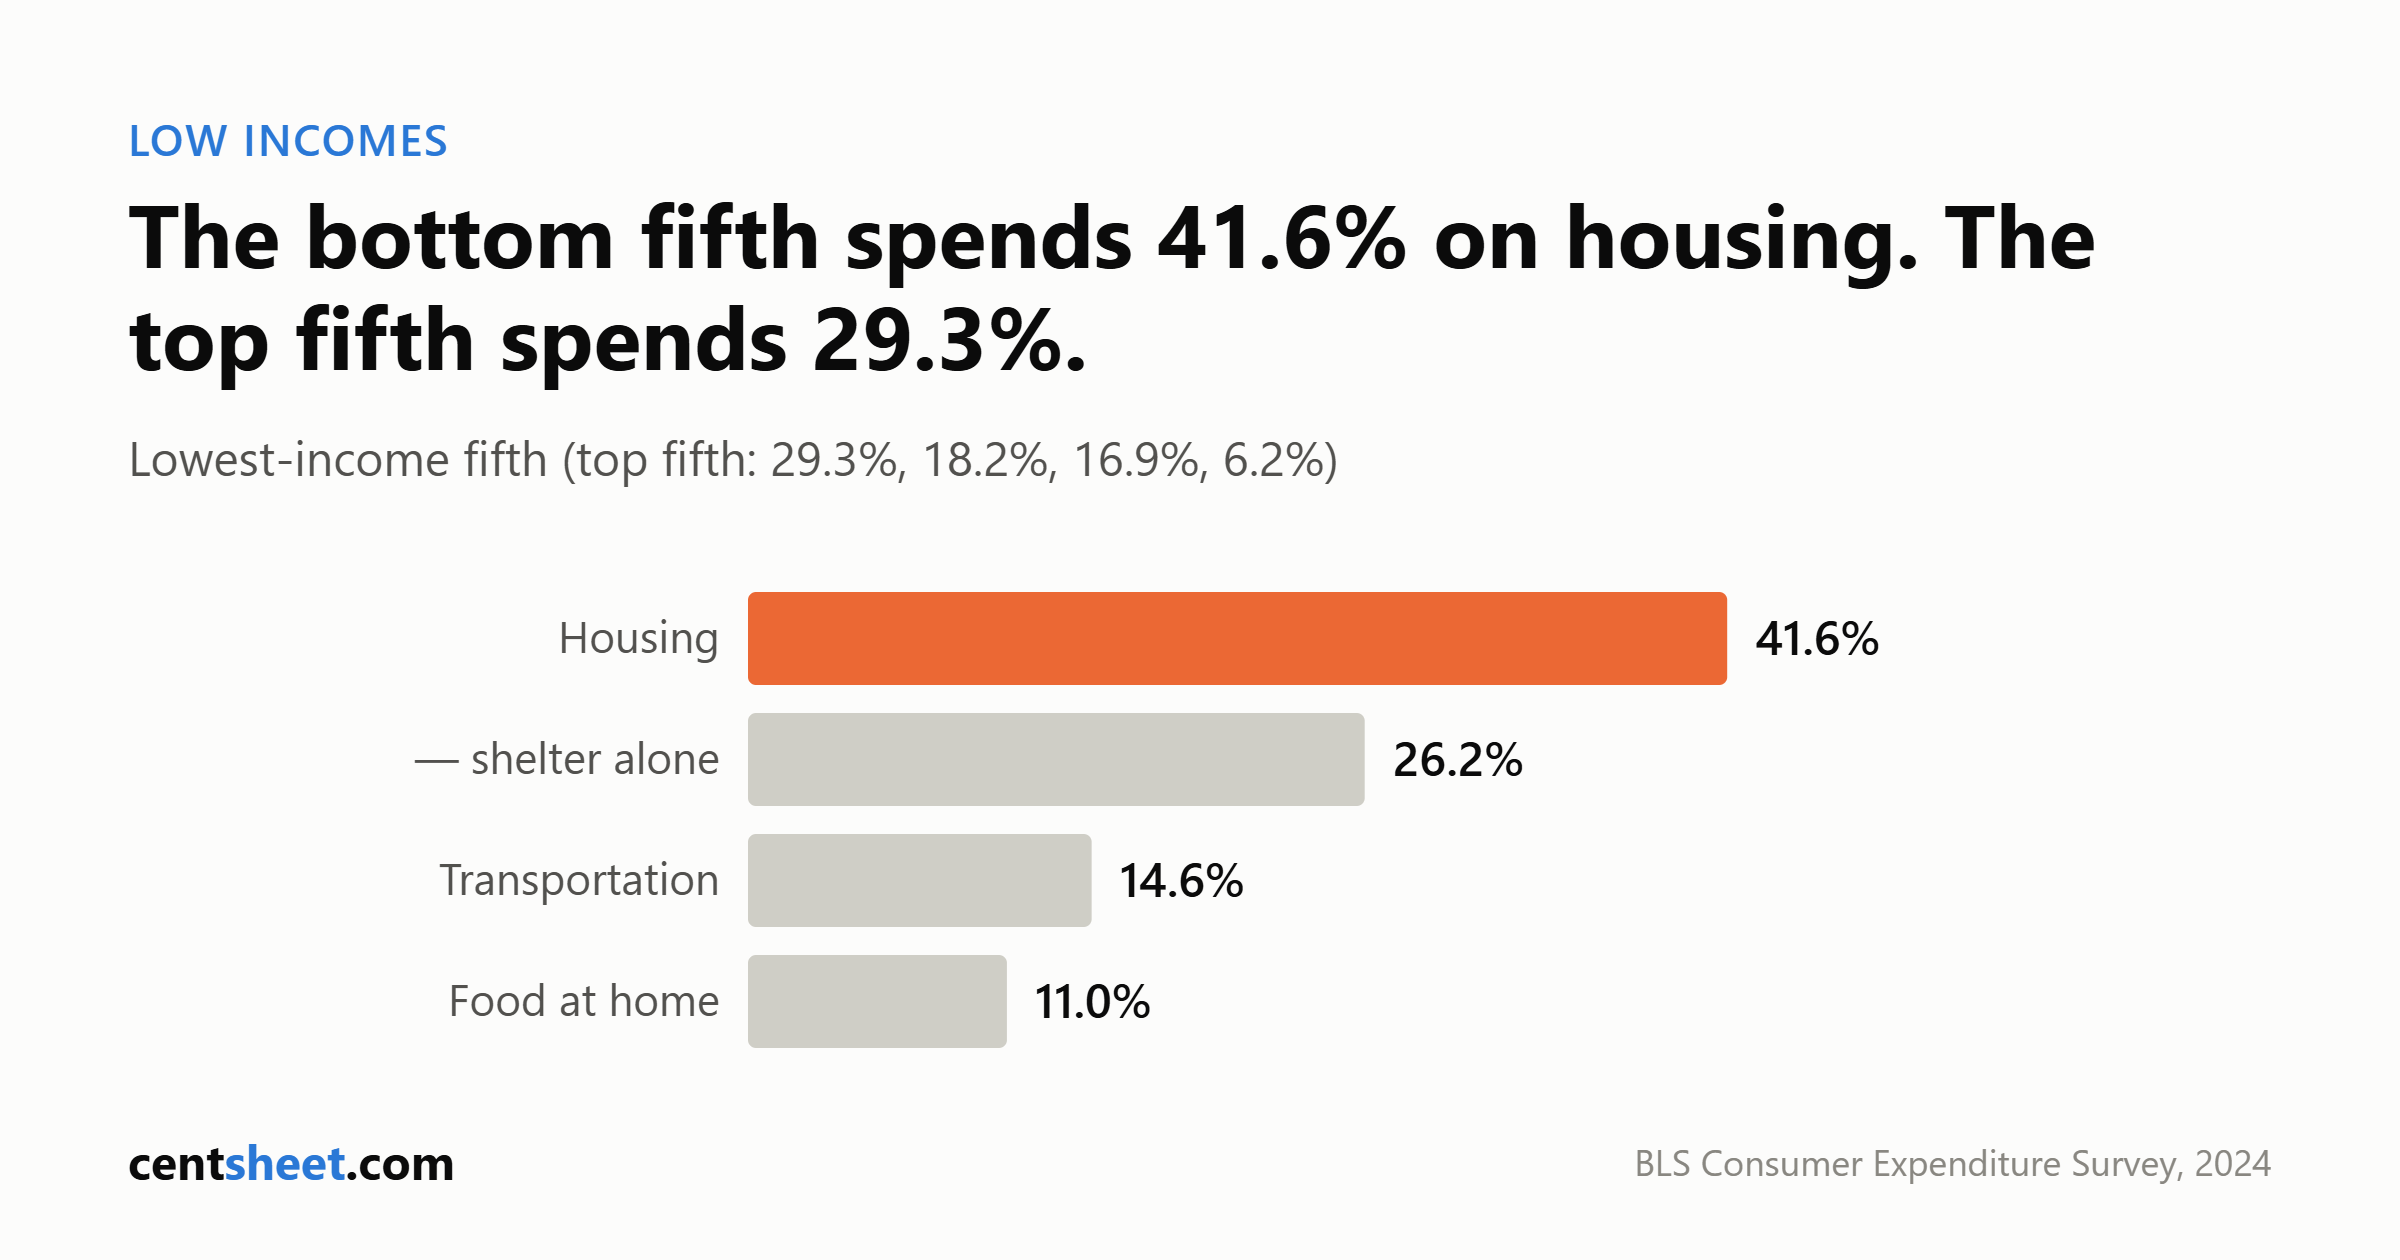
BLS sorts US consumer units into fifths by pre-tax income. In 2024 the lower bound of the second fifth was $29,932, so the lowest fifth is roughly everyone below that — about 27 million consumer units. Every percentage below is a share of total expenditures, not of income.
| Share of total annual spending, 2024 | Lowest fifth | Highest fifth |
|---|---|---|
| Housing | 41.6% | 29.3% |
| — shelter alone | 26.2% | 18.2% |
| Transportation | 14.6% | 16.9% |
| Food at home | 11.0% | 6.2% |
| Food away from home | 4.7% | 5.1% |
| Healthcare | 9.8% | 6.5% |
| Personal insurance and pensions | 2.0% | 18.1% |
Source: BLS Consumer Expenditure Survey, Table 1101, 2024, released December 2025. Shares do not sum to 100 due to rounding.
Housing, transportation, healthcare and all food together come to 81.7 percent of spending in the lowest fifth against 64.0 percent in the highest — our sum of the published shares. The categories usually called fixed take four-fifths of the budget at the bottom, and what is left is smaller in dollars too.
The last row is not a savings rate and we will not use it as one. That BLS category bundles mandatory Social Security payroll deductions and life insurance premiums with voluntary retirement contributions; in the lowest fifth — $711 a year, 2.0 percent of spending — it is close to entirely payroll tax. Anyone claiming the poorest fifth “only save 2 percent” is misreading the line.
One more figure needs care: mean expenditures in the lowest fifth were $35,046 in 2024 against mean pre-tax income of $16,658. That is a long-documented feature of the survey, not evidence of overspending — it reflects income underreporting, non-cash transfers, savings drawdown, borrowing and irregular income. BLS does not endorse a simple overspending reading.
Why the percentage rules break
The 50/30/20 split was popularized by All Your Worth by Elizabeth Warren and Amelia Warren Tyagi, published in 2005 by Free Press. Sources disagree on whether the book invented the rule or only spread it; we found nothing setting out the split earlier but could not access the book’s text, so “popularized by” is as far as we go.
The rule is normally stated on after-tax income. Apply the savings leg to that $16,658 mean and you get $3,331.60 a year, about $278 a month. That is CentSheet arithmetic, and the assumption matters: it uses pre-tax income because BLS published no after-tax income estimates for 2024 at all — the provider of the tax model BLS relies on did not update it for tax year 2024. After-tax income is lower, so $278 a month is a generous ceiling, not a target.
The housing leg behaves the same way. HUD defines cost burden as monthly housing costs including utilities above 30 percent of monthly income, and severe cost burden as above 50 percent. Thirty percent of $16,658 is about $416 a month for rent and utilities together — again our arithmetic, pairing a BLS consumer-unit income mean with a HUD threshold defined on adjusted household income, which are different constructs. The observed housing share in the lowest fifth is 41.6 percent.
A rule assigning 50 percent to needs is not one a household spending 81.7 percent on needs can fail; it does not describe them. Worth naming who publishes it: looking for a government or peer-reviewed evaluation of 50/30/20, we found none — every result was a bank, credit union, brokerage or SEO blog. Our stress test is at 50/30/20 under pressure.
The macro picture does not support the target either. BEA put the US personal saving rate at 2.7 percent in June 2026, or $646.1 billion — a national accounts aggregate, total personal saving over total disposable personal income, dominated by high-income households, and not a household mean or median. The whole economy is banking 2.7 percent while the rule asks for 20. Yield will not close that: the FDIC national average was 0.38 percent for savings and 0.65 percent for money market accounts as of July 20, 2026, so where cash sits is an access decision — see HYSA vs CD vs T-bills — not an income strategy.
The $400 question, stated correctly
The Fed’s most-quoted measure is routinely misquoted. It asks how people would cover a hypothetical $400 emergency. In the 2025 survey, 63 percent said cash, savings, or a credit card paid off at the next statement. The other 37 percent would use some other method — carrying a balance, borrowing, selling something — and 12 percent said they could not pay it by any means. “Four in ten Americans can’t afford $400” is not what was measured.
| Family income (2025 survey) | Money left over at month end | Three-month rainy day fund | Doing okay or living comfortably |
|---|---|---|---|
| Less than $25,000 | 19% | 21% | 45% |
| $25,000-$49,999 | 26% | 39% | 55% |
| $50,000-$99,999 | 38% | 55% | 74% |
| $100,000 or more | 59% | 75% | 91% |
| All adults | 41% | 55% | 73% |
Source: Federal Reserve, Economic Well-Being of US Households in 2025, published May 2026. These are the Fed’s income brackets, not quintiles. The 55 percent of adults with a three-month fund is down from 59 percent in 2021. On sizing one when three months is out of reach, see how much emergency fund you actually need.
The poverty premium is real and badly measured
It costs more to be poor. Overdraft and non-sufficient-funds fees, check cashing, small-pack unit pricing, weekly-payment leases, insurance priced by ZIP code, utility deposits — each falls on people with less liquidity, and hardest when the shortfall is smallest.
We are naming the mechanism, not quantifying it. We could not source a single primary figure for any of those premiums: no average overdraft cost, no check-cashing spread, no small-pack price gap, no insurance differential. Every candidate traced to a vendor, a retailer or a marketing blog. If such a number is quoted at you, check who published it and when.
What we do have is that 0.38 percent FDIC average: the typical deposit account earns almost nothing, so the fee side of a banking relationship is where nearly all the money is decided. Two things are worth doing anyway. Overdraft coverage is opt-in for debit card transactions and can be declined — see overdraft protection. And recurring bills are negotiable more often than people expect; the wording is in our bill negotiation scripts. What either saves, we will not say. That figure does not exist in any source we would cite.
The advice that targets the wrong line
“Stop eating out” is the most durable piece of low-income money advice, and the spending data does not support it. Food away from home is nearly flat across the distribution: 4.7 percent of spending in the lowest fifth, 5.1 percent in the highest. The difference sits in food at home — 11.0 percent against 6.2 percent — and that is groceries.
Two federal sources conflict here and get blended constantly. USDA’s Economic Research Service reports that of $2.51 trillion in US food expenditures in 2025, $1.41 trillion went to food away from home against $1.10 trillion at home. BLS shows the opposite for households in 2024: $6,224 mean food at home against $3,945 away. Both are right — the ERS series covers all purchasers, including government food assistance and employer-provided meals, while BLS measures self-reported household spending. More in grocery budget math.
Benefits, and the number we cannot give you
Food assistance is the one program we can put figures to. For fiscal year 2026 — October 1, 2025 through September 30, 2026 — the maximum monthly SNAP allotment in the 48 states and DC is $994 for a four-person household and $298 for one person. USDA sets maximums from the cost of the Thrifty Food Plan each June and builds in economies of scale, so smaller households get slightly more per person.
That plan’s reference family — two adults aged 20-50 plus children aged 6-8 and 9-11 — cost $1,018.20 a month, or $235.00 a week, in the May 2026 report. The gap to the FY2026 maximum is $24.20 a month, a subtraction of ours whose assumption matters: the maximum was set from a June 2025 plan cost, so this is a snapshot, not a policy statement. USDA’s footnotes add caveats: the plan assumes every meal is prepared at home, and it rests on 2013-16 consumption and 2015-16 price data reindexed monthly by CPI, so only the price adjustment is current. USDA also publishes a family-of-four total for the Thrifty plan alone, which is why circulating “family of four” figures for the other plans disagree with each other.
What we cannot give you is a take-up rate. We have no primary-sourced figure for how many eligible households fail to claim SNAP, so we will not assert that some large sum goes unclaimed, however often you have read it. Check eligibility with your state agency, not a third-party site. For scale: 13.7 percent of US households, 18.3 million, were food insecure in 2024, and 5.4 percent had very low food security — not a statistically significant change from 13.5 percent in 2023.
Where this stops being a budgeting problem
No envelope method and no app moves a 41.6 percent housing share. That number is set by rent, by what coverage costs, by whether a car is needed to hold a job, and by wages — a policy question, and treating it as a discipline problem is a category error. Which does not mean nothing is worth doing. It means the honest claim is small: a few hundred dollars a year of avoided fees is real money, and it is not a savings plan.
The short version
1. Ignore the 20 percent. Set a dollar figure you can clear. Ten dollars a week is a working system; 20 percent of after-tax income is not, if it never happens — and BLS could not publish 2024 after-tax income at all, so the rule’s denominator is missing. 2. Work the two biggest lines. Housing and transportation are 56.2 percent of spending in the lowest fifth (our sum of the BLS shares). Nothing done to the remainder competes with a change to either. 3. Turn off overdraft coverage. It is opt-in for debit transactions and punishes small shortfalls hardest — overdraft protection. 4. Negotiate the recurring bills, not the groceries. Phone, internet and insurance renewals are where a script has leverage — bill negotiation scripts. 5. Check food assistance eligibility with your state agency if food is tight. The FY2026 maximum is $994 a month for four people, $298 for one, through September 30, 2026. 6. Distrust any promised savings number. We found no primary source for what switching banks, cancelling subscriptions or coupon apps save. Ask who published the figure. 7. Do not read a shortfall as a personal failure. Nineteen percent of adults in families under $25,000 end the month with anything left — a distribution, not a character trait. If the cycle is the problem, getting out of paycheck to paycheck covers the mechanics.
CentSheet publishes educational content, not personalized financial advice, and nothing here is legal, tax, or benefits-eligibility advice — confirm program eligibility with the administering agency.
Get the CentSheet Money Brief
Email me CentSheet weekly: practical money decisions, new calculators, and useful worksheets. Unsubscribe anytime.