The most-quoted number in disability insurance — that more than one in four of today’s 20-year-olds will become disabled before retirement — comes from a Social Security Administration page that no longer exists. We fetched the URL on August 6, 2026: a 157-byte stub with no statistic in it. Thousands of insurance-industry pages still link to it.
The underlying number is real. It is smaller than the version quoted, and narrower.
Where the number comes from
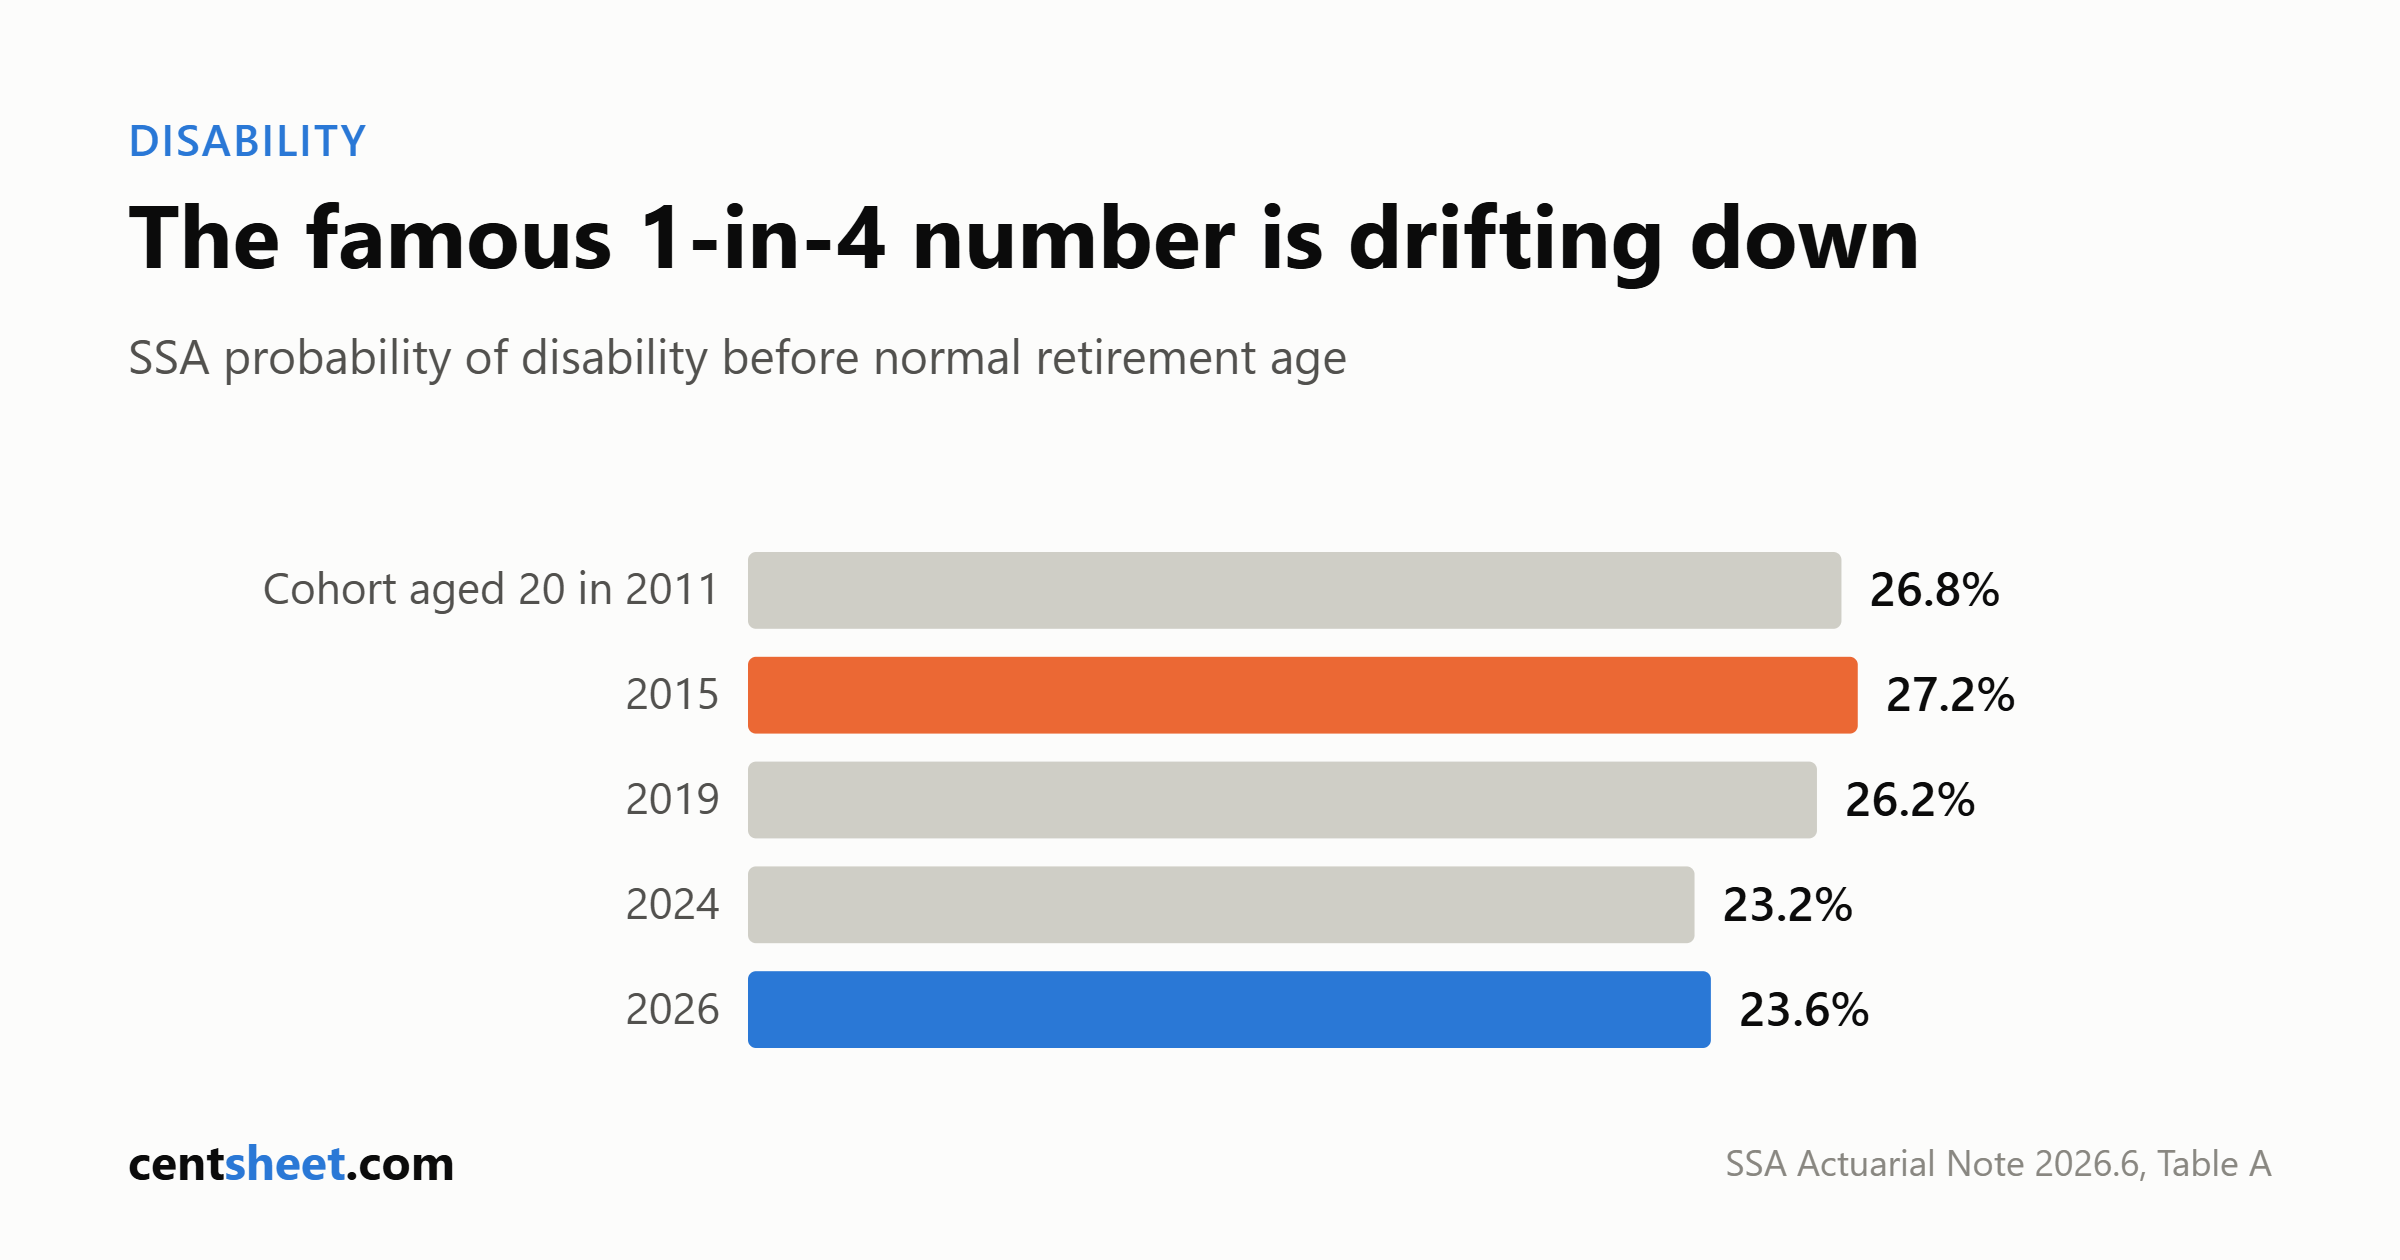
In Actuarial Note No. 2026.6, released July 2026, SSA’s Office of the Chief Actuary puts the probability that an illustrative worker attaining age 20 in 2026 becomes disabled before normal retirement age — 67 for that cohort — at 0.236. The summary text rounds to 24 percent overall, men 23 and women 24; Table A gives 0.232 for men and 0.239 for women. Same numbers, different rounding. It has been falling.
| Cohort attaining age 20 in | Probability of disability before NRA |
|---|---|
| 2011 | 26.8% |
| 2015 | 27.2% |
| 2019 | 26.2% |
| 2024 | 23.2% |
| 2026 | 23.6% |
Source: SSA Actuarial Note No. 2026.6, Table A, July 2026.
“More than 1 in 4” was accurate when SSA wrote it. The archived capture of the retired page, dated June 5, 2023, uses that phrasing beside an average monthly benefit of about $1,234 “as of the beginning of 2019” — stale even then. Today the honest version is “about one in four.”
Two qualifiers matter more than the rounding. This is not a probability for all 20-year-olds: the illustrative worker becomes insured at 20 and maintains insured status thereafter, and footnote 3 says computing incidence rates this way “gives a larger probability of disability entitlement than if all workers were included in the calculations.” And it is a probability of qualifying for SSDI — inability to engage in any substantial gainful activity from impairments expected to cause death or last 12 continuous months. Plenty of conditions that stop you working for a year do not clear that bar.
SSDI is not a plan
SSA pays only for total disability. In its own wording, no benefits are payable for partial disability or for short-term disability, and it states the assumption plainly: that “working families have access to other resources to provide support during periods of short-term disabilities.”
For 2026, substantial gainful activity means monthly earnings above $1,690 (non-blind) or $2,830 (blind). Work credits accrue at one per $1,890 of wages or self-employment income, $7,560 for four. Five continuous months of disability are required before benefits are payable; the first lands in the sixth full month.
Across claims filed 2014 through 2023, SSA’s Annual Statistical Report on the SSDI program (2024 edition, December 2025) puts the final award rate at an average of 29 percent and denials at 68 percent — initial awards run 18 to 21 percent, reconsideration adds 2 percent, hearings 7 percent. The report shows 21.5 percent for 2023, but SSA warns that rate rises as pending claims clear: 186,886 from that year were still open.
As of June 2026, 7,006,000 disabled workers were receiving SSDI at an average monthly benefit of $1,634.87, after a 2.8 percent cost-of-living adjustment effective January 2026. CentSheet calculation: $1,634.87 × 12 = $19,618 a year, assuming twelve months at the June 2026 average and no further COLA.
Coverage runs by paycheck
BLS measures access through the National Compensation Survey. March 2025 reference month, published September 25, 2025:
| Worker group | Short-term disability access | Long-term disability access |
|---|---|---|
| Civilian workers | 42% | 38% |
| Private industry | 44% | 37% |
| State and local government | 27% | 41% |
The government row runs both ways, so “government workers have better disability coverage” is half true — and BLS cautions against comparing the sectors directly. BLS also records “legally required” as a funding method for short-term plans, so the 42 percent includes state-mandated coverage. It is not a count of employers who chose to offer the benefit.
The sharper cut is by wage — civilian workers, March 2025:
| Wage group | Short-term access | Long-term access |
|---|---|---|
| Lowest 10% | 9% | 4% |
| Bottom 25% | 22% | 11% |
| Top 25% | 59% | 62% |
| Highest 10% | 66% | 68% |
Long-term access runs 4 percent in the lowest wage decile against 68 percent in the highest. It splits the same way by hours: 47 percent of full-time civilian workers have it, against 7 percent of part-time.
That is a structural distribution, not a discipline problem. The households least able to absorb a year without income have almost no chance of being offered the product. If that is your position the lever is cash — emergency fund math, and the paycheck-to-paycheck exit first.
Own occupation versus any occupation
One definitional choice decides whether a policy pays. NAIC’s market conduct reporting instructions (version 2026.0.0, updated May 2025) define both: “own occupation” covers a claimant returning to previous employment or the same class as defined in the policy, “any occupation” a claimant returning at a materially different job class. Insurers report claims closed under each definition separately, because the two tests reach different verdicts on the same claimant. A surgeon with a hand tremor is disabled under one and likely not the other.
The convention that group LTD runs own-occupation for 24 months and then switches is real in the market, but we could not source the 24-month figure to any statute, regulatory document or BLS series. NAIC defines both terms and states no duration. The switch date, if your policy has one, is in your certificate.
Elimination period and benefit period
The elimination period is the gap between onset of disability and benefit eligibility. NAIC lists “claimant returned to work during elimination period” as its own denial reason, which tells you how often that gap decides a claim.
Nobody publishes a national average. We searched BLS’s full benefits provision dictionary: there is no series for elimination or waiting period, for either product. Any article citing “BLS says the typical elimination period is 90 days” invented it. What is sourced describes three different products:
- NAIC consumer guidance (May 2020, now stale) says a 30-day waiting period is common, and longer waits carry lower premiums.
- The same article says long-term coverage generally begins six months after the disability and can run to retirement age.
- New York’s Department of Financial Services (individual disability income checklist, December 2020, also stale) treats elimination periods no longer than 180 days as reasonable, and requires insurers seeking longer to justify it.
The sources do not connect those three, and no single “typical elimination period” spans them.
BLS puts the median short-term benefit at 26 weeks, and describes short-term plans as paying per disability for 6 to 12 months and long-term plans as paying monthly after a waiting period or after other benefits end. Whether yours hand off cleanly is a question for your two certificates.
The replacement ratio and the two caps
Among civilian workers in long-term disability plans as of March 2025, 96 percent have a benefit set as a fixed percent of annual earnings. The average is 57.9 percent (57.4 percent in private industry); the median is 60.0 percent. Sixty-three percent sit at exactly 60 percent, 7 percent at exactly 67 percent. Short-term plans average 62.8 percent.
Sixty percent is not generosity withheld. The “Relation of Earnings to Insurance” provision — cited by NY DFS to NY Insurance Law §3216(d)(2)(F) in that December 2020 checklist — provides that where loss-of-time benefits under all valid coverage exceed the insured’s earnings when disability commenced, the insurer owes only a proportionate share and returns the excess premium. Income insurance may not pay more than the income. The rule serves insurers, who avoid moral-hazard claims, and regulators, who do not want stacked policies making disability pay better than work. Defensible. Not “the amount you need.”
The second cap is in dollars and gets almost no coverage. Of civilian LTD participants with a fixed-percent formula, 90 percent have a maximum monthly benefit; the median maximum is $10,000.
CentSheet calculation: a 60 percent formula meets a $10,000 ceiling at $200,000 of annual salary (0.60 × $200,000 ÷ 12 = $10,000). Above that, effective replacement keeps falling. Assumptions: fixed percent of annual earnings paid monthly, median cap, no offsets. That $10,000 is the median cap, not what anyone receives — we could find no data on average benefits actually paid.
The tax rule that decides whether 60 percent is really 60 percent
Per IRS Publication 525 (2025 edition), amounts received for injury or sickness through an employer-paid plan are in most cases reportable as income; if you paid the premiums, the benefits are not taxable. Publication 15-A (2026) gives the mechanics. In IRS’s own example, a worker receives $2,000 a month in sick pay under a policy funded 70 percent by the employer and 30 percent by employees with after-tax dollars.
| Portion of $2,000 monthly benefit | Funded by | Tax treatment |
|---|---|---|
| $1,400 | Employer (70%) | Taxable sick pay |
| $600 | Employee, after tax (30%) | Not taxable, no employment taxes |
The split is set by the cost share over the three policy years before the year of payment, not by what you elected this year.
Now the trap. Paying your own premium is not enough; it must be after-tax. Publication 525: if you are covered through a cafeteria plan and the premium was not included in your income, you are not considered to have paid it, and benefits are taxable. Publication 15-A agrees — cafeteria-plan contributions are employer contributions unless they are after-tax employee contributions. A pre-tax payroll deduction that looks like a small monthly win converts a tax-free benefit into a taxable one. The one other route to tax-free benefits: your employer pays the premium but includes it in your income.
Whether SSDI benefits themselves are taxable is a separate set of rules we did not research, as is whether individual premiums are deductible.
What nobody publishes
The cost of an individual policy as a share of income. The “1 to 3 percent of your salary” line is everywhere. NAIC’s consumer material carries no premium figure, actuarial-body research on individual disability income covers persistency, lapse and claim experience instead, and state regulator material does not have it. An explicit research target that came back empty. Treat any such figure as a vendor’s estimate unless tied to a named rate table.
“51 million working adults have no disability insurance.” Widely circulated, widely attributed to SSA. We could not verify it against any SSA publication; it appears to originate in industry awareness campaigns.
What to actually do
1. Establish whether you have coverage, and which type. Roughly two in five civilian workers had access to each product as of March 2025, and the odds lengthen below the top wage quartile. 2. Open the certificate of coverage, not the benefits-portal summary. The summary says “60 percent.” The certificate gives the definition of disability, the elimination period, the dollar cap and the offsets. 3. Read the definition of disability first — own occupation or any occupation, and if it switches, on what date. That clause decides more claims than the percentage does. 4. Check whether the dollar maximum binds. A 60 percent formula against a $10,000 cap starts biting at $200,000 — our arithmetic, assumptions above. 5. Find out whether your premium is pre-tax or after-tax. Only after-tax premiums produce tax-free benefits. 6. Assume SSDI is not the plan. The 2014–2023 average final award rate was 29 percent, benefits start in the sixth full month at the earliest, and the June 2026 average was $1,634.87 a month. 7. Size the elimination period in cash — a savings requirement, not an insurance question. Start with budgeting on variable income if your earnings already swing.
We will not tell you whether to buy a policy, or from whom. No insurer-level data went into this article, and any ranking built without it would be marketing.
CentSheet publishes educational content, not personalized financial advice, and nothing here is legal, tax or insurance advice.
Get the CentSheet Money Brief
Email me CentSheet weekly: practical money decisions, new calculators, and useful worksheets. Unsubscribe anytime.