Strip the jargon and an index fund is one idea: instead of betting on which companies win, buy a sliver of all of them. A fund tracking a broad index (the S&P 500, or a total-market index) holds hundreds or thousands of stocks in one purchase, weighted by size. You’re not picking winners; you’re buying the market’s aggregate result — the average.
“Average” sounds like settling. The empirical record says otherwise, for one structural reason.
Why average is a high bar
The market’s return is the collective result of everyone trading in it — mostly professionals. Before costs, the average actively-managed dollar earns the market return by definition; after fees, trading costs, and taxes, the majority of professional funds trail their index over long periods — a result the S&P’s own scorecards have documented year after year for decades. Buying the index doesn’t mean accepting mediocrity; it means declining to pay for a coin-flip at beating a number most professionals miss.
The index investor’s edge isn’t cleverness. It’s cost — which brings us to the number this article exists for.
The fee table nobody frames properly
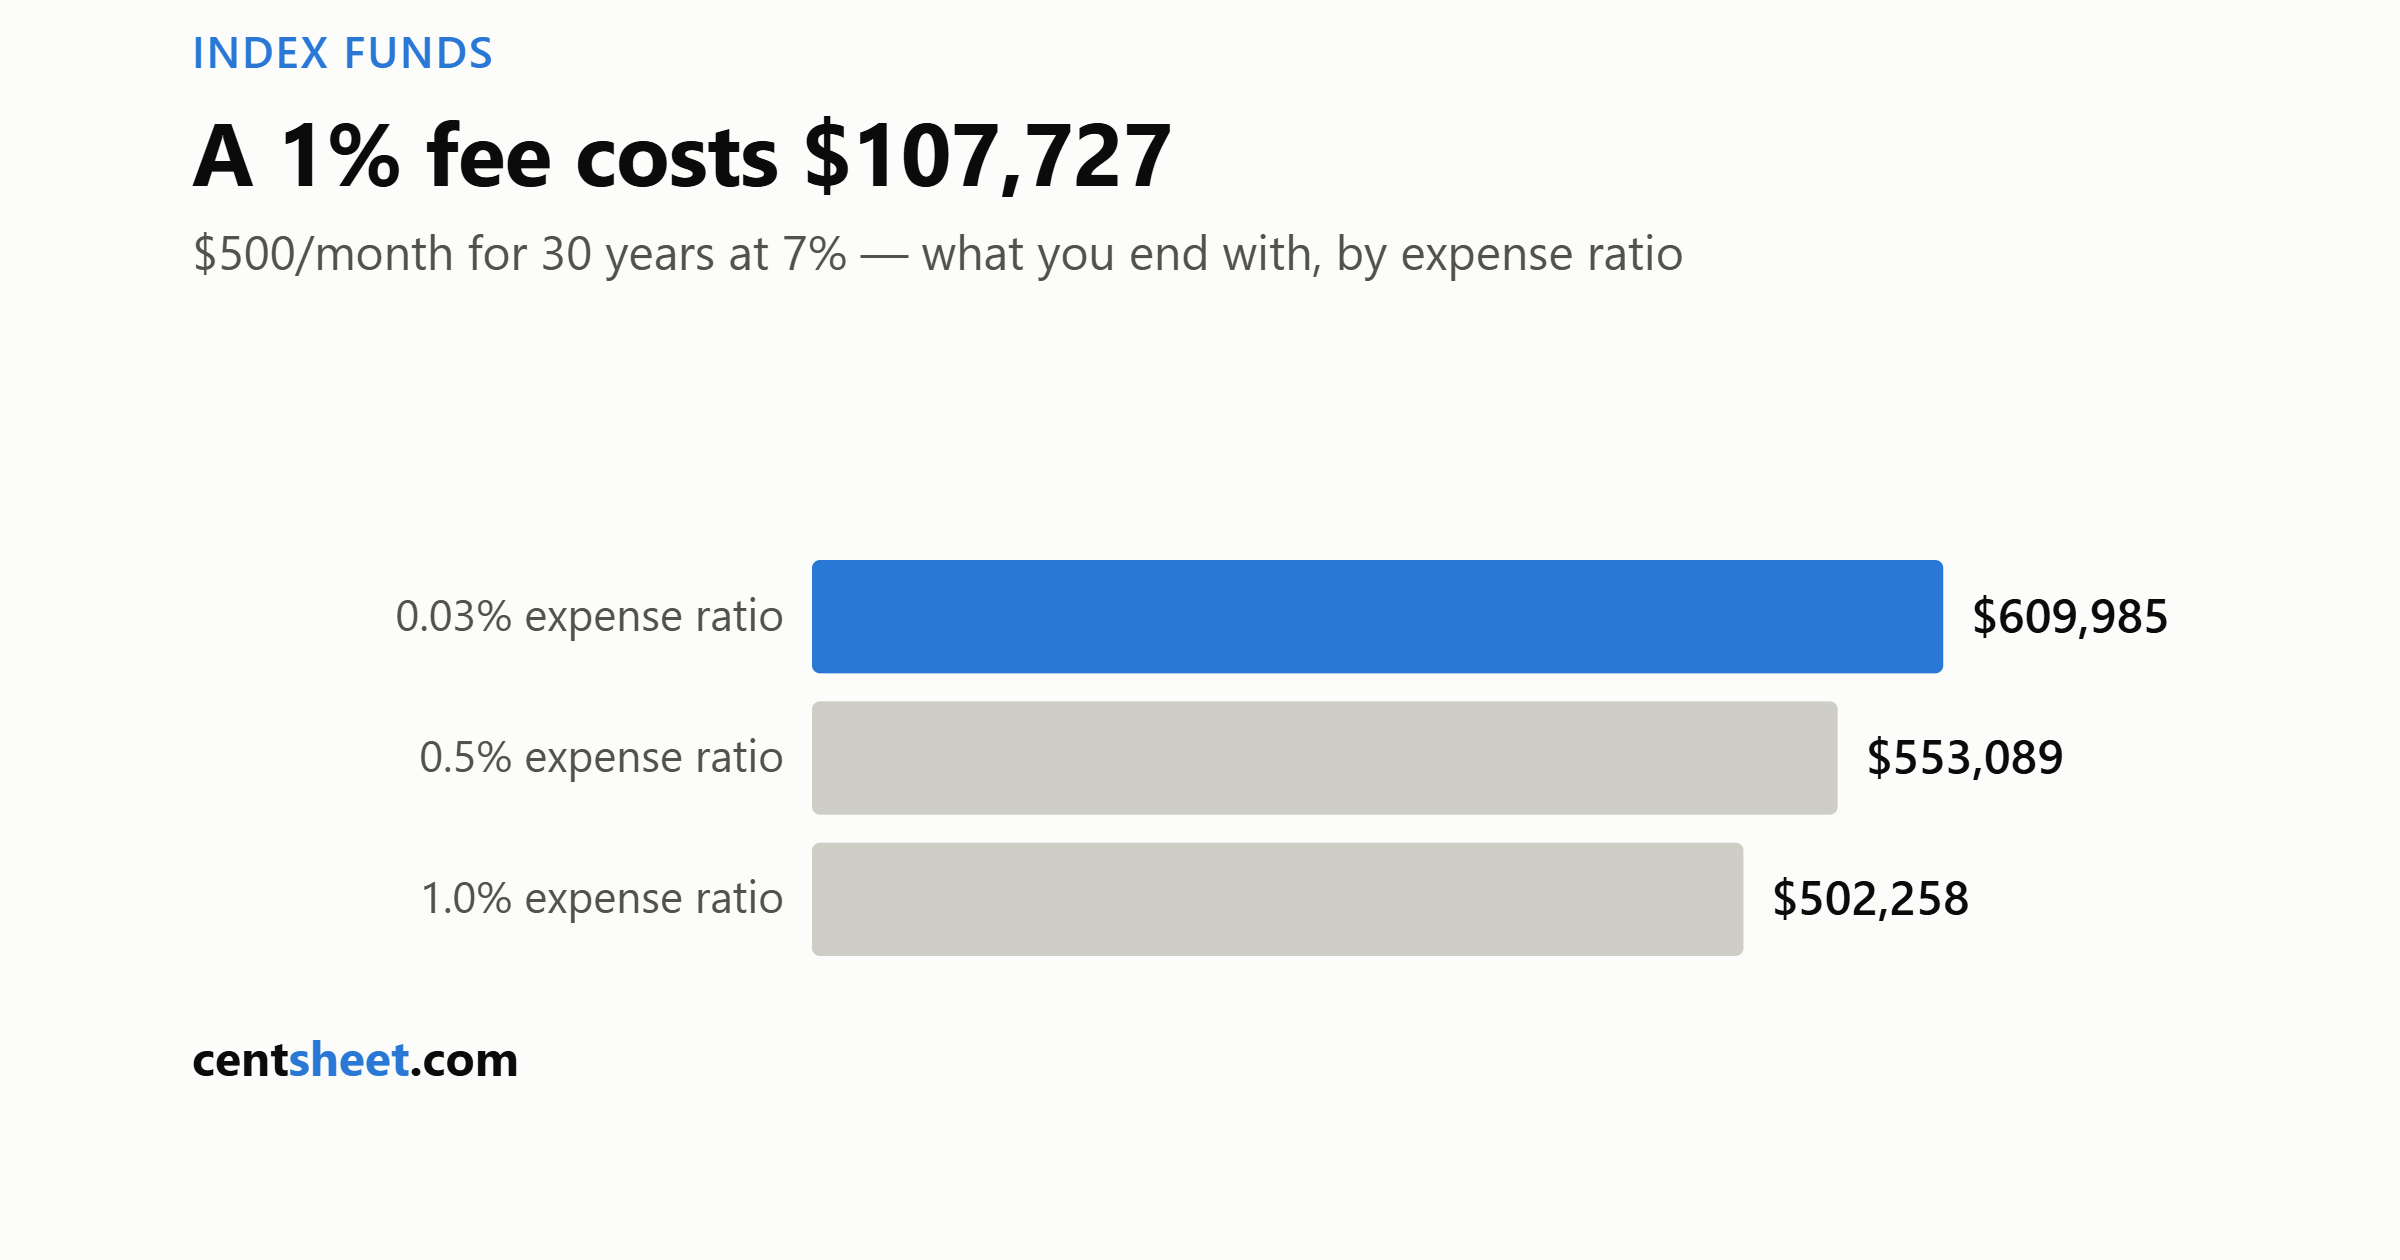
Fees are quoted as an “expense ratio” — a percentage that sounds like nothing. 1% — who’d flinch? Here’s 1%, properly framed: $500/month for 30 years, market returning 7%:
| Expense ratio | You end with | The fee took |
|---|---|---|
| ~0.03% (typical broad index fund) | $609,985* | — |
| 0.5% | $553,089 | $56,896 |
| 1.0% | $502,258 | $107,727 |
\modeled at 7.0% net for simplicity; a 0.03% drag is real but pennies in this frame.*
A 1% fee doesn’t cost “1%.” It compounds against you every year, and over a working lifetime it consumes about a sixth of your final wealth — the same exponential arithmetic that builds the pile, leaking. This is why the expense ratio is the one number on a fund page that deserves veto power. Broad index funds from the major providers now charge 0.02–0.10%; anything near 1% needs an extraordinary justification that, statistically, it won’t deliver.
What buying one looks like
The mechanics are genuinely undramatic: a brokerage account (major US brokers charge $0 commissions and no minimums), one broad fund — “total US market” or “S&P 500” index funds are the standard cores; their long-run results are near-identical — an automatic monthly buy, the same payday automation as everything else, and then the hard part: doing nothing, for decades, including through the years the chart is red.
That last clause is the actual skill. The 7% long-run assumption contains crashes; the historical return belonged only to people who didn’t sell during them.
What this article is deliberately not
Not a recommendation of any fund or provider, and not a claim that stocks are where your next dollar belongs — that depends on whether the 24% card is paid off, whether the emergency fund exists, and on tax-advantaged account choices (401(k)s, IRAs) that deserve their own articles. The sequence matters more than the fund.
And one boundary we hold everywhere: nobody — including us, including the confident person on YouTube — knows what the market does next year. Index investing’s honest promise is narrower and better: whatever the market does, you’ll get approximately that, minus almost nothing.
CentSheet publishes educational content, not personalized financial advice, and holds no position on any fund or provider. Projections are illustrations at an assumed constant rate.
Get the CentSheet Money Brief
Email me CentSheet weekly: practical money decisions, new calculators, and useful worksheets. Unsubscribe anytime.