The average US FICO Score is 714, according to FICO’s Spring 2026 Credit Insights report, released March 24, 2026 and reflecting October 2025 data. That is down two points from 716 a year earlier.
The more interesting number is the one underneath it: a record 48.1% of US consumers score 750 or higher, up from 43.3% in 2019.
Both of those are true at once, and the tension between them is the actual story.
The average has been sliding for two years
The 714 is not a sudden drop. It is the fourth step down in a row:
| Reading | Average FICO Score |
|---|---|
| April 2024 | 717 |
| January 2025 | 716 |
| April 2025 | 715 |
| October 2025 | 714 |
You will see the 714 described as the first annual decline since 2013. That framing belonged to the earlier report — the drop to 715 in April 2025 — and has been recycled onto this one. The current reading is a continuation, not a first.
FICO attributes the decline primarily to the resumption of student loan delinquency reporting, plus a modest continued rise in mortgage delinquencies. Notably, the other categories went the other way: auto, credit card and personal loan delinquency rates leveled off or improved over the same period. This is not a broad consumer collapse. It is concentrated.
Which is why the top keeps growing
At the same time the average fell, the share of consumers at 750 or above hit a record. FICO’s own framing is a market splitting in two rather than declining uniformly — a record share of consumers demonstrating strong, consistent credit behavior, alongside a segment whose scores are being pulled down by a specific reporting change.
An average is a poor summary of a two-humped distribution. If your score dropped this year, the honest read is not “everyone’s did” — for most people, it didn’t.
Experian’s number is 713, and that is not a contradiction
Experian publishes its own average: 713 as of September 2025, also down two points year over year.
The gap is construction, not disagreement. FICO uses its own national multi-bureau sample; Experian uses an Experian-only aggregated sample and labels it FICO Score 8. Different data, different snapshot dates, same direction. Use whichever you like — but name the source with the number, and never split the difference into a made-up 713.5.
(You may also see 718 attributed to Experian for Q4 2025. Experian’s own published figure is 713. The 718 appears to be an aggregator error.)
The distribution
Experian’s September 2025 breakdown, which is far more useful than any single average:
| Band | Share of consumers |
|---|---|
| Poor (300–579) | 14.7% |
| Fair (580–669) | 14.9% |
| Good (670–739) | 20.1% |
| Very Good (740–799) | 27.5% |
| Exceptional (800–850) | 22.8% |
About 70% of consumers are at 670 or above. The single largest band is Very Good — the distribution leans high, which is why “above average” is a much weaker position than it sounds. At 714 you are at the median-ish middle of a top-heavy field, not ahead of it.
Roughly a quarter of consumers reach 800 or higher, and more than half of that group is over 60 — which brings us to the strongest pattern in the data.
Age explains more than anything else
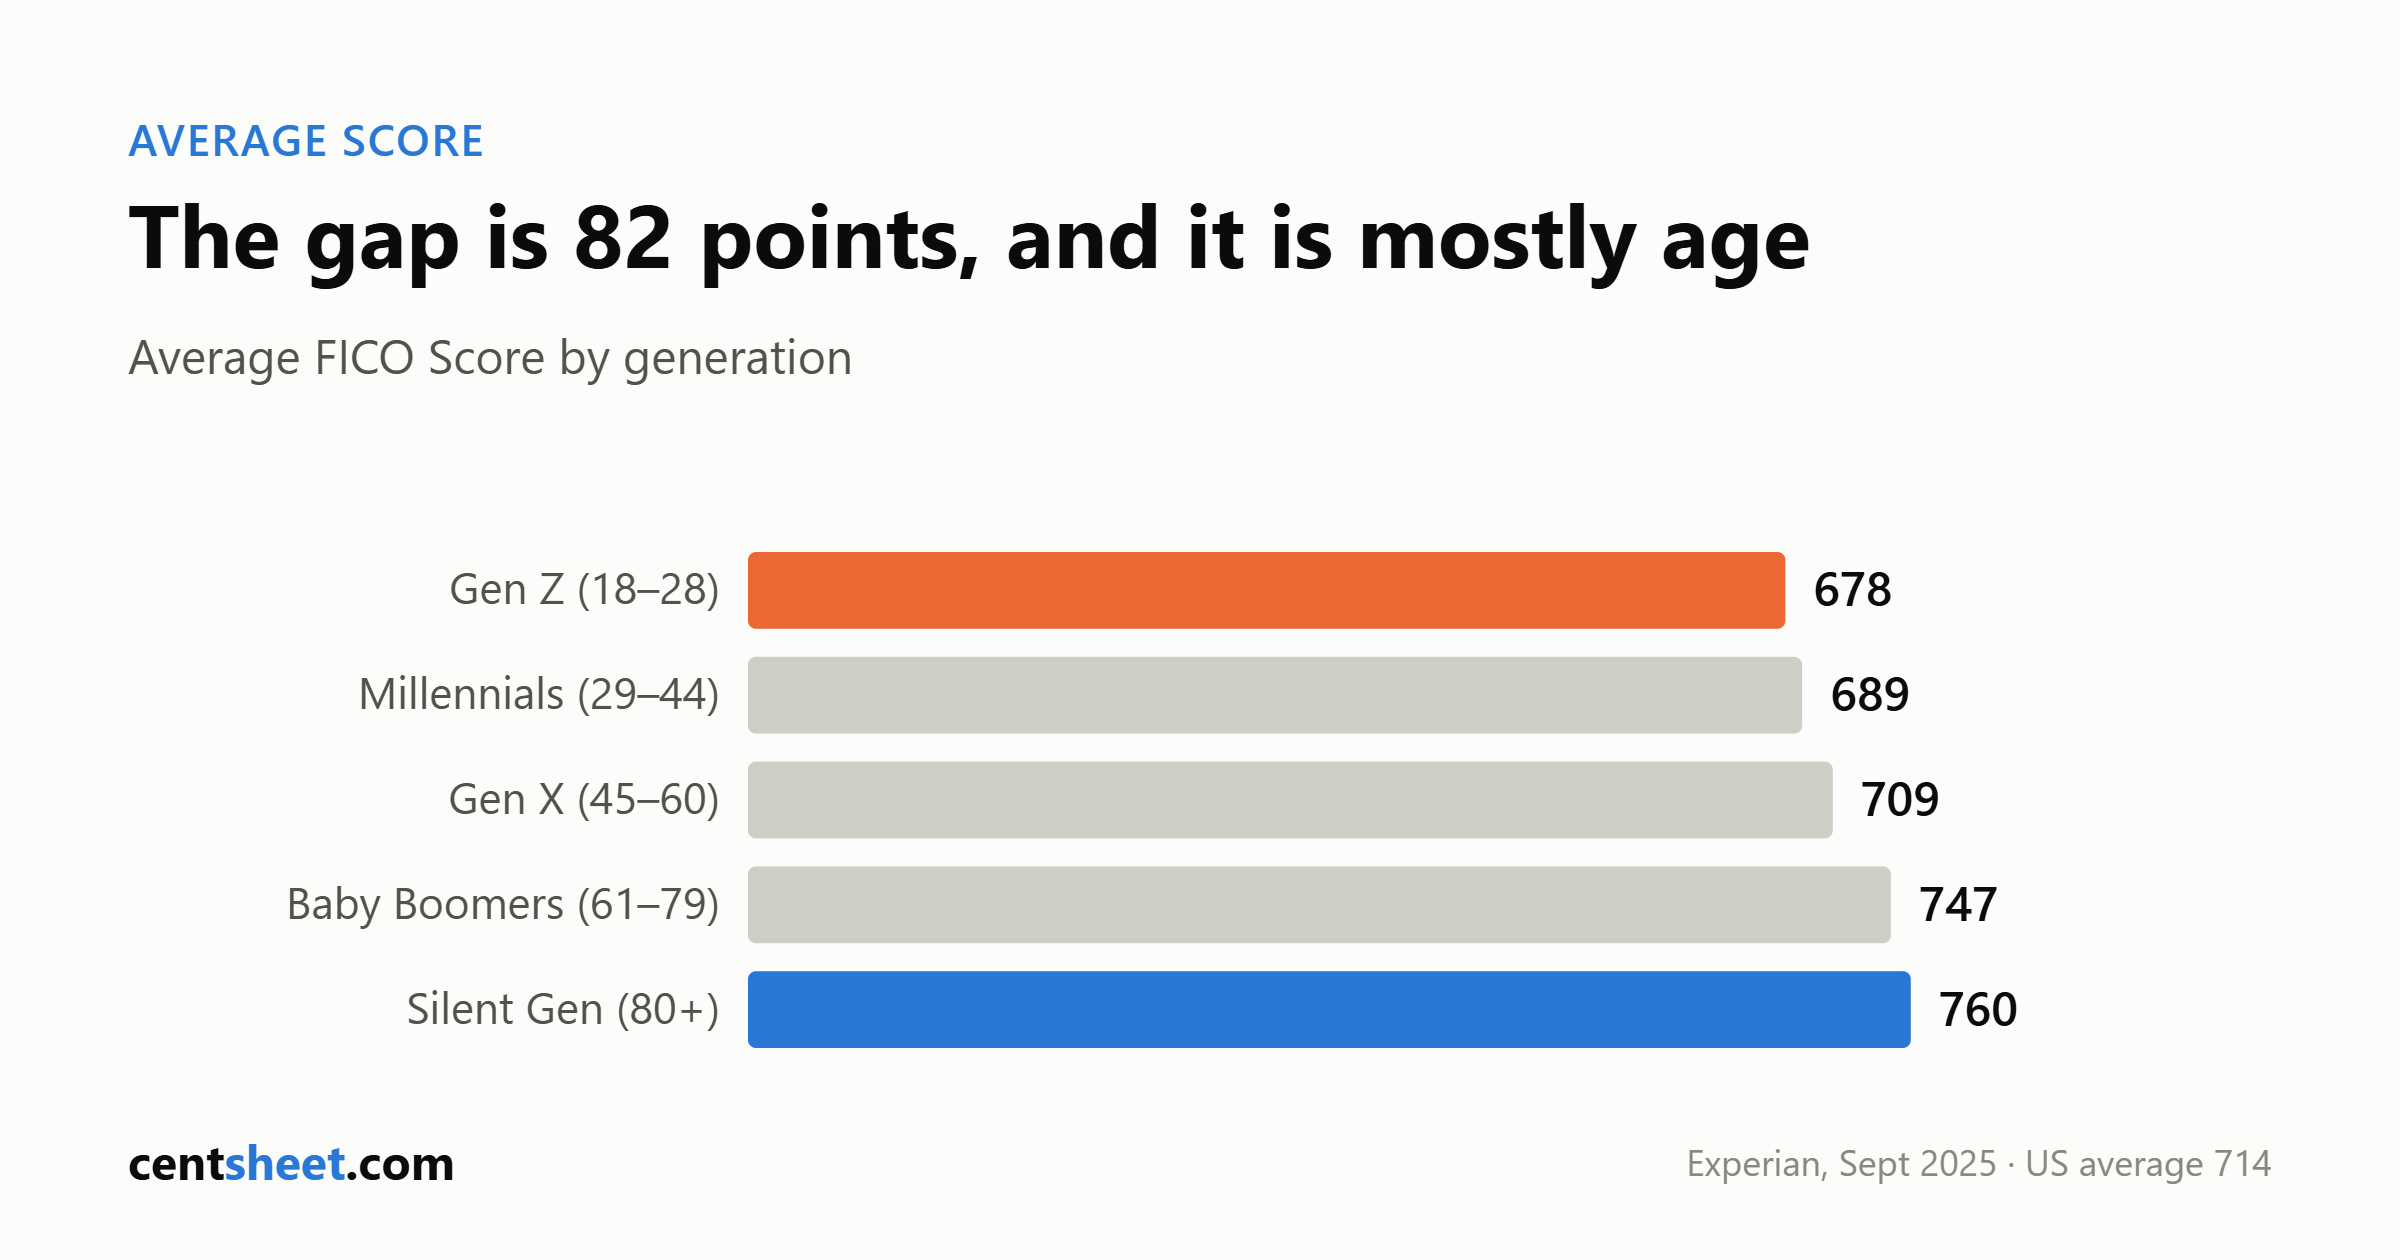
Average FICO Score by generation, per Experian (September 2025):
| Generation | Average | Year-over-year |
|---|---|---|
| Gen Z (18–28) | 678 | −3 |
| Millennials (29–44) | 689 | −2 |
| Gen X (45–60) | 709 | unchanged |
| Baby Boomers (61–79) | 747 | +1 |
| Silent Generation (80+) | 760 | unchanged |
That is an 82-point spread from youngest to oldest, and the declines are concentrated entirely at the young end — consistent with the student-loan explanation.
Length of credit history is a scoring factor you cannot shortcut, negotiate, or optimize. A 22-year-old with flawless behavior still cannot have a 15-year-old account. If you are young and your score feels stuck below the averages above, a meaningful part of that gap closes on its own with nothing but time.
By state
Experian’s September 2025 figures put Minnesota highest at 741, followed by Vermont and Wisconsin at 737. The lowest are Mississippi at 677, Louisiana at 686 and Alabama at 689 — a 64-point gap between the top and bottom state.
Most states declined over the year. Louisiana and Washington, D.C. fell the furthest at four points each; Illinois, Maine and Vermont were the only ones that held steady.
VantageScore says 702, and it is measuring something else
VantageScore’s CreditGauge put the average VantageScore 4.0 at 702 in June 2026, up one point month over month and a 12-month high. It read 701 in both February and March 2026.
Do not put 702 and 714 in the same sentence as though one is rising and the other falling. They are different models, on different samples, at different dates. VantageScore’s June 2026 data actually looks healthy on its own terms — card delinquencies eased year over year across all stages, and overall utilization declined both monthly and annually.
Two averages from two proprietary models are two facts, not a trend and a counter-trend.
What the average is actually good for
Honestly: very little, on its own.
No lender approves or declines against a national average. No rate sheet references it. Your score matters only against the specific cutoffs of the specific product you are applying for — and those vary enormously. For a mortgage, the pricing bands and program floors are what count, and the best conventional pricing tier starts at 780, far above any average.
The average is useful for exactly two things:
1. Calibration. If you are at 640 and assumed that was normal, it isn’t — about 70% of consumers are above 670. 2. Perspective when your score moves. A two-point national drift means small movements in your own number are often noise, not a signal that you did something wrong.
If you want the number to move, the mechanics that actually respond are utilization and payment history — and no honest source will quote you an exact point value for either, because both models are proprietary and both companies say impact depends on your whole file.
CentSheet publishes educational content, not personalized financial advice. Figures are dated where cited; credit statistics are revised and re-released regularly.
Get the CentSheet Money Brief
Email me CentSheet weekly: practical money decisions, new calculators, and useful worksheets. Unsubscribe anytime.