Almost every article on this question gives you a number: 620 for a conventional loan, 580 for FHA, 640 for USDA. One of those three is gone for most conventional loans, one still stands, and the third was never a published rule.
Here is what the primary sources actually say, checked in August 2026 and updated in September 2026.
Fannie Mae deleted its minimum in November 2025
In Selling Guide Announcement SEL-2025-09, Fannie Mae removed the 620 minimum credit score for loans underwritten through Desktop Underwriter — the automated system that underwrites the large majority of conventional loans. The language is unambiguous: minimum credit score requirements “will no longer apply to loans submitted to DU,” which instead “will rely on its own comprehensive analysis of risk factors to determine eligibility.”
It applies to both single-borrower files and the 620 average-median requirement for multiple borrowers. The announcement is dated November 5, 2025 and took effect for new loan casefiles created on or after November 16, 2025.
That is a real change. It is also routinely overstated, in three ways:
1. Manually underwritten conventional loans still have a floor — 620 for fixed-rate, 640 for ARMs. 2. Pricing is still tiered by score, all the way down to a “below 640” bucket on Classic FICO. Removing the gate did not remove the toll booth. 3. Lenders impose their own overlays. One major correspondent investor’s conventional product profile, dated August 3, 2026, still requires an automated approval with a minimum 620. The agency floor is gone; your lender’s may not be.
The actual floors, by programme
| Programme | Published minimum | Notes |
|---|---|---|
| Conventional (DU-underwritten) | None | Removed Nov. 16, 2025 |
| Conventional (manual) | 620 fixed / 640 ARM | Eligibility Matrix |
| FHA | 580 for 3.5% down; 500 for 10% down | Below 500: ineligible |
| VA | None set by VA | Lenders set their own |
| USDA | None published | See below |
FHA is the one programme with genuinely explicit thresholds, and they are tied to your down payment. Handbook 4000.1: a Minimum Decision Credit Score at or above 580 is eligible for maximum financing (96.5% LTV, so 3.5% down); between 500 and 579 you are limited to 90% LTV, meaning 10% down. Below 500, “the Borrower is not eligible for FHA-insured financing.”
There is a second penalty below 580 that gets far less attention: those borrowers are capped at 31% housing and 43% total debt-to-income, with no compensating factors permitted to stretch it. A 580 and a 579 are not one point apart in practice — they are on opposite sides of both a down-payment rule and a DTI rule.
VA sets no minimum score at all. VA.gov is explicit that lenders “may also require you to meet additional standards,” which may include a credit score. Any number you have been told is a VA minimum came from a lender, not the VA.
USDA is the interesting one. The 640 minimum that appears in essentially every article on this subject does not appear in the current USDA handbook. HB-1-3555 Chapter 10, as revised August 5, 2025, contains no numeric credit score threshold whatsoever — instead, “GUS will determine the acceptable credit score to be used for the underwriting recommendation.” The 640 language does exist in an older, undated, superseded draft of that chapter, which is almost certainly where the figure everyone repeats came from. Treat 640 as a widespread lender practice, not USDA policy.
Which score they pull is not the score you check
Mortgage lenders do not use the score in your banking app. They pull all three bureaus — the tri-merge requirement is still in place — and they use older, mortgage-specific FICO versions: Equifax Beacon 5.0, Experian/Fair Isaac Risk Model V2, and TransUnion FICO Risk Score Classic 04. The one alternative so far: since 9 September 2026, any Fannie Mae or Freddie Mac approved lender may choose VantageScore 4.0 instead for eligible loans it sells to them (more below).
Then they pick one.
FHA defines it explicitly. Its Minimum Decision Credit Score is the median of three reported scores, or the lower of two if they differ. With multiple borrowers, the lender uses the lowest MDCS across all of them — which means a co-borrower with thin or damaged credit sets the score for the entire file, regardless of who earns more.
Fannie Mae calls it the “representative credit score”, and for pricing it works the same way on every loan: the middle of three scores (or the lower of two) for each borrower, then the lowest of those across borrowers. An average of the borrowers’ median scores is used only to test the minimum score on certain manually underwritten loans. Ask your lender which convention applies to your programme.
This is why people get blindsided. The free score you have been watching climb is often a different model, on a different version, from a different bureau than the one that will actually price your loan.
The real answer: it’s priced, not gated
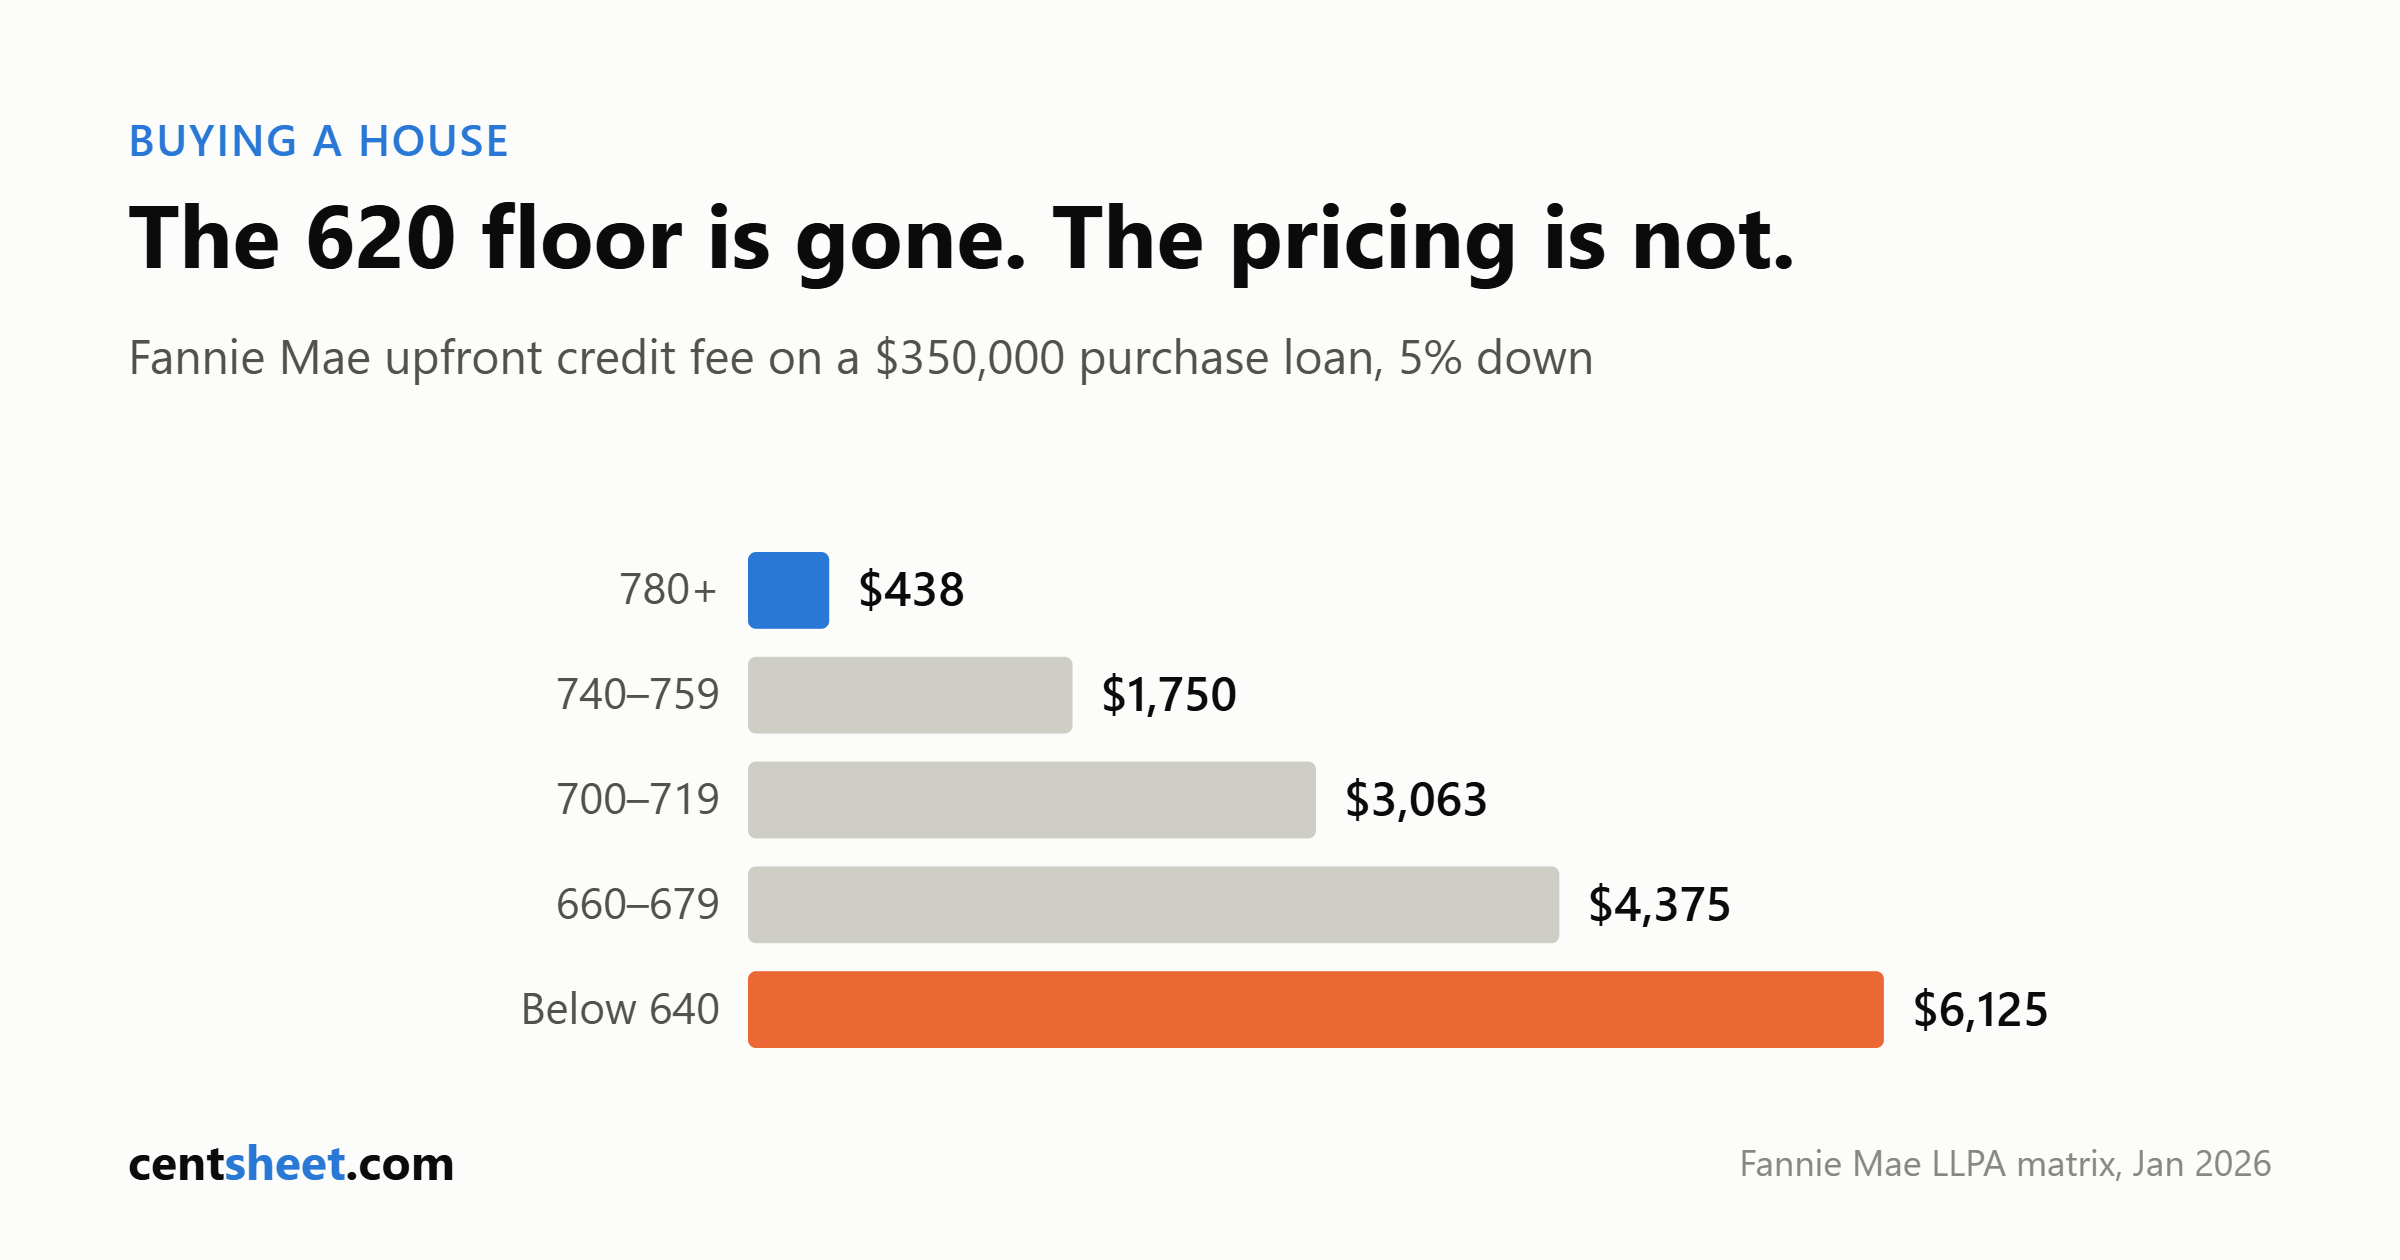
Since the gate is disappearing, the number that matters is what each score band costs. Fannie Mae publishes this openly in its Loan-Level Price Adjustment matrix — an upfront fee, expressed as a percentage of the loan, charged by credit score and down payment. The best tier starts at 780 on Classic FICO, not 740 and not 800.
From the matrix dated 9 September 2026, for a purchase loan priced on Classic FICO (these figures are unchanged from the 28 January 2026 version):
| Score | LLPA at >95% LTV | LLPA at 75.01–80% LTV |
|---|---|---|
| 780+ | 0.125% | 0.375% |
| 740–759 | 0.500% | — |
| 700–719 | 0.875% | — |
| 660–679 | 1.250% | — |
| Below 640 | 1.750% | 2.750% |
Note the counterintuitive part: the penalty is larger for the borrower putting 20% down than for the one putting less than 5% down. Mortgage insurance is already absorbing risk on the low-down-payment loan, so the score surcharge is smaller there. On a $350,000 loan, the gap between a 780+ borrower and a sub-640 borrower runs roughly $5,700 at high LTV and about $8,300 at 75–80% LTV — our arithmetic on Fannie Mae’s published percentages, typically paid as points or baked into the rate.
The 9 September matrix also adds separate grids for loans priced on VantageScore 4.0. For purchase loans the fees are the same, but every band sits 20 points higher: the top tier starts at 800 rather than 780, and the bottom bucket is 659 and below rather than 639 and below. The two scales are not interchangeable, so ask which model your loan is priced on before reading your band off either grid.
What it costs in actual market rates
Fee schedules are one thing; locked rates are another. The Optimal Blue Mortgage Market Indices track real locked rates on roughly a third of US mortgage transactions. For 30-year fixed conforming loans at 80% LTV or below, August 2026 monthly averages (the latest full month):
| FICO band | Average rate |
|---|---|
| 740+ | 6.607% |
| 720–739 | 6.683% |
| 700–719 | 6.700% |
| 680–699 | 6.763% |
| Below 680 | 6.796% |
That top-to-bottom spread is 0.19 percentage points — smaller than most people expect. On a $350,000 30-year fixed:
- $2,237/month at 6.607% versus $2,281/month at 6.796% — about $44 a month.
- Over five years, roughly $2,630 more paid out, about $3,330 more in interest, and you would still owe about $700 more on the balance.
- Over the full 30 years, about $15,800 more interest — but only if you never refinance, sell, or prepay, which most borrowers do.
For low-down-payment loans (above 80% LTV) the August range was 6.678% to 6.874% — a similar spread, working out to about $46 a month and roughly $16,400 over 30 years.
September is running higher. Averaging the daily readings from 1 to 22 September, the table’s bands (80% LTV or below) ran from 6.839% (740+) to 7.026% (below 680): every band up between 0.20 and 0.25 points from August, with the top-to-bottom spread still about 0.19 points. The whole market moved; the price of a lower score barely did.
Two honest caveats. These are averages across many lenders, loan sizes and points structures — not a rate sheet, and not a quote you are entitled to. And you will see claims that a low score costs $50,000 to $87,000 in extra interest; those compare a much wider score gap than the bands above.
Where you actually stand
The average US FICO Score is 714 in FICO’s Fall 2026 report (released 25 August 2026, on April 2026 data): flat since October 2025 and down one point year over year, after a slide FICO has tied mainly to resumed student loan delinquency reporting. Its Spring 2026 report counted a record 48.1% of consumers at 750 or higher, up from 43.3% in 2019 — FICO describes a market splitting in two rather than uniformly declining.
If you are above 740, you are already in the top rate band in the table above and further points buy you very little on the rate itself (though 780 on Classic FICO still helps on fees). If you are below 620, FHA is likely your path, and the 580 threshold is the one worth targeting because it changes your down payment requirement, not just your rate.
What is changing next
In April 2026, FHFA and HUD announced the adoption of newer scoring models — the first meaningful change in decades. Both sides have since moved. On 9 September 2026, Fannie Mae and Freddie Mac opened VantageScore 4.0 to all their approved lenders, removing the earlier requirement for prior written approval. On 10 September, FHA set 1 January 2027: for case numbers assigned on or after that date, it will accept VantageScore 4.0 and FICO 10T alongside Classic FICO, on forward mortgages scored through its TOTAL Scorecard, with its 500 and 580 thresholds unchanged and a tri-merge credit report still required.
VantageScore 4.0 is an option for conventional lenders, not a requirement; Classic FICO remains approved, with no retirement date announced; and FHFA says FICO 10T “is not currently eligible for delivery” to Fannie Mae or Freddie Mac. FHA’s Alternative Credit Scores Preparedness Guide tells lenders to keep following Handbook 4000.1 until new guidance is published and the 1 January date arrives. Whichever model a lender uses, every borrower on the loan must be scored on the same model or models — so ask which model will price yours.
What to actually do
1. Pull the right score. Ask your lender for a tri-merge before you shop, and which model it will price on — the mortgage FICO versions or VantageScore 4.0. Your app score is not the input. 2. Know your median, and your co-borrower’s. If a co-borrower’s score sets the file, running the loan on one income may cost less than it saves. 3. Target a band edge, not a round number. Going from 738 to 742 crosses a pricing line. Going from 742 to 758 mostly does not. 4. Fix utilisation first — it is the fastest-moving major factor and responds within a statement cycle or two. 5. Do not open or close anything while you are in process. New accounts and closed limits both move the number, and your lender will re-pull. 6. Compare the down payment trade-off honestly. A bigger down payment can lower your LLPA band and your loan size — sometimes worth more than a score increase you would need a year to earn. Run it against your down payment timeline and the full cost of ownership.
One thing no responsible source will give you: an exact point value for any single action. FICO and VantageScore are proprietary models, both companies say impact depends on your entire file, and anyone quoting you “pay this off, gain 40 points” is guessing.
CentSheet publishes educational content, not personalised financial advice. Rate and fee figures are dated where cited and change frequently; verify current terms with your lender. Figures updated 24 September 2026.
Get the CentSheet Money Brief
Email me CentSheet weekly: practical money decisions, new calculators, and useful worksheets. Unsubscribe anytime.