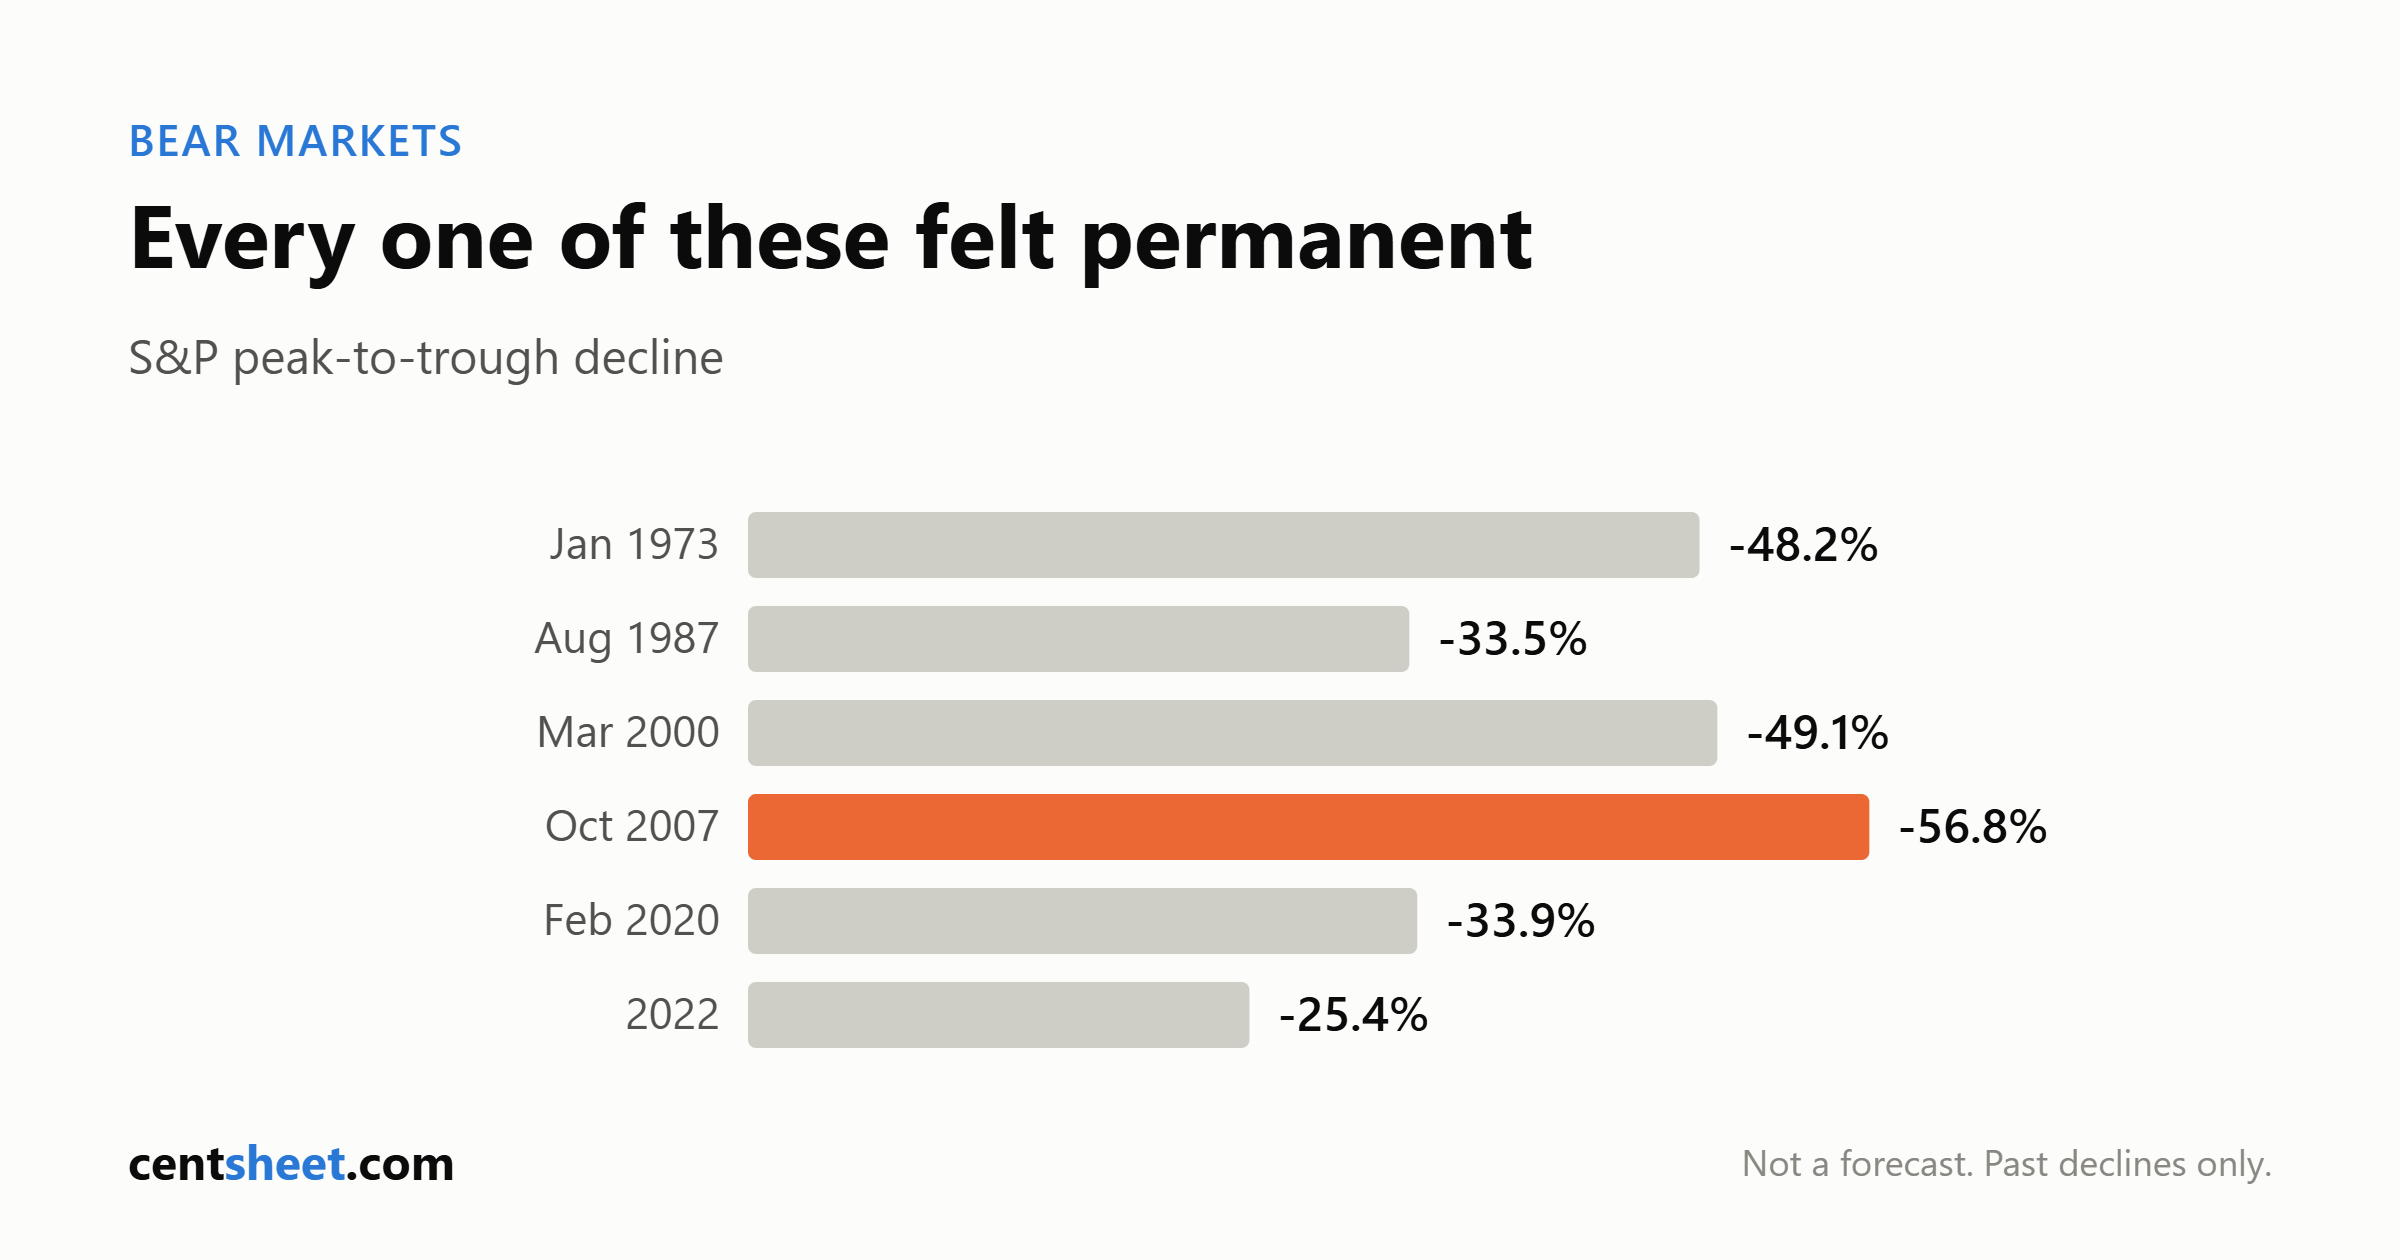
In late May and June 2020, weeks after the S&P 500 had fallen 33.9% from peak to trough in 33 calendar days, the FINRA Investor Education Foundation and NORC at the University of Chicago asked 1,795 US households what they had done with their investments. Only about a third — 34% — made any trade at all, and among those who did, more bought (26%) than sold (21%). Of the two-thirds who did nothing, 35% had considered buying and 11% had considered selling.
The mass panic these articles are written to prevent did not show up in the data. Nor has anyone published a credible figure for what selling cost the people who sold. Every number below is historical, and none of it forecasts anything.
Two regulators, two definitions of a bear market
No single authoritative US definition exists for either term, and the two federal-level sources most readers would trust disagree.
| Term | Source | Definition |
|---|---|---|
| Bear market | SEC, Investor.gov glossary (undated) | A broad market index falls by 20% or more over at least a two-month period |
| Bear market | FINRA, June 2025 | A decline of 20 percent or more in a broad market index — no duration test |
| Correction | FINRA, June 2025 | Prices “reverse course by at least 10 percent” before resuming the previous trend — either direction, no upper bound |
| Correction | Yardeni Research, citing S&P | Declines of 10% or more, but less than 20%; 5%–10% moves are “minor” |
| Correction | SEC | No glossary entry exists |
The duration clause matters more than it looks. The February–March 2020 decline ran 33 calendar days peak to trough — arguably short of the SEC’s two-month test, plainly a bear market under FINRA’s and S&P’s. The 10% correction threshold routinely attributed to the SEC is not the SEC’s. And the thresholds are arbitrary at the edges: the 2018 decline came in at 19.8% and the 2011 decline at 19.4%, corrections rather than bear markets by a rounding error.
The historical record, and what it does not tell you
Yardeni Research compiles S&P 500 declines of 20% or more from Standard & Poor’s data. Selected episodes, by peak date:
| Peak | Decline | Calendar days, peak to trough |
|---|---|---|
| Sep 1929 | -44.7% | 67 |
| Apr 1930 | -83.0% | 783 |
| Mar 1937 | -54.5% | 390 |
| Jan 1973 | -48.2% | 630 |
| Aug 1987 | -33.5% | 101 |
| Mar 2000 | -49.1% | 929 |
| Oct 2007 | -56.8% | 517 |
| Feb 2020 | -33.9% | 33 |
| 2022 | -25.4% | 282 |
Read that column heading carefully. It is time from the peak to the bottom, not time to get back to the peak. We could not verify a recovery-time table from any source we were able to read, so this article contains none. If you have seen “the average bear market lasts 9.6 months and takes 3.1 years to recover,” treat it as unverified until someone shows you the series behind it. Nor are we printing a count of US bear markets: counts differ by definition, by intraday versus closing prices, and by whether adjacent declines get merged. Yardeni’s long table stops in 2020; the 2022 line comes from a separate briefing dated December 30, 2023. Nothing here covers 2024 onward — we could not obtain the primary index data.
The best-days statistic, and who publishes it
The most quoted number in this genre comes from asset managers. The version we verified is Wells Fargo Investment Institute’s — an interested party, since it sells investment management — dated July 28, 2025, using S&P 500 daily data from July 1, 1995 through June 30, 2025.
| Scenario | Average annual return, WFII’s figures | $10,000 over those 30 years (CentSheet calculation) |
|---|---|---|
| Fully invested | 8.4% | ~$112,000 |
| Missed the 30 best days | 2.1% | ~$18,700 |
| Missed the 40 best days | 0.7% | ~$12,300 |
| Missed the 50 best days | -0.6% | ~$8,300 |
The dollar column is our arithmetic: each stated average return compounded for 30 years on a single $10,000 investment, no taxes, no fees, no further contributions. It is a back-cast of a historical average, not a projection. Wells Fargo’s own disclosure matters — the series is a price index that “does not include the reinvestment of dividends,” so the 8.4% baseline understates what a dividend-reinvesting holder received and cannot be set against dividend-inclusive figures quoted elsewhere. Average inflation over the period was 2.5% by the same report, putting the bottom two rows below zero in real terms. On why small differences in annual return widen like that, see compound interest with real numbers.
The critique that usually gets left out
Printing that table without what follows is the standard dishonesty in this genre.
The best days and the worst days are the same days. Wells Fargo says so in the same report: of the ten best trading days by percentage gain, nine occurred during recessions and six also fell inside a bear market. Three of the 30 best days and five of the 30 worst landed within the eight trading days between March 9 and March 18, 2020. No strategy misses the worst days and keeps the best, because they arrive in the same week.
Run it in the other direction and the asymmetry reverses. Javier Estrada, a finance professor at IESE Business School, examined more than 160,000 daily returns across 15 international equity markets for the Journal of Investing in Fall 2008. Missing the best 10 days left portfolios 50.8% less valuable than a passive investment. Avoiding the worst 10 days left them 150.4% more valuable. Estrada’s conclusion was not that patience is rewarded but that timing is futile in both directions — “market timing may be an entertaining pastime, but not a good way to make money” — and that broad diversification is the answer.
Clifford Asness of AQR Capital Management — also an interested party, since AQR sells active and quantitative strategies — has argued since a 1999 draft, republished on AQR’s site on June 5, 2025 with data through April 2024, that the statistic examines only one tail and is “an obvious and one-sided statement.” His finding: “the returns from market timing are relatively symmetric.” From his 1970–1996 table, missing the 12 best months cost 5.1 percentage points a year; missing the 12 worst added 5.8.
Three credible sources, one phenomenon, three conclusions. Wells Fargo uses it to argue for tactical asset allocation, which aligns with what it sells. Estrada uses it to argue no timing works. Asness uses it to argue the statistic settles nothing either way.
Averaging in is a decision about new cash, not a shield for old money
Dollar-cost averaging gets recommended in every downturn, and it is a decision about cash not yet invested. It does nothing for a portfolio already fully invested and falling. FINRA says it “has lower risk but often produces lower returns than lump sum investing, especially over longer periods.”
Vanguard — an interested party, since it benefits when cash gets invested — found in February 2023 that on US data (Russell 3000, 1979–2022) investing a lump sum immediately beat a three-month split 66.4% of the time over one-year horizons. In the worst outcomes that flipped: at the 5th percentile with 100% equity, cost averaging ended ahead, $85,906 against $82,947 on $100,000. Vanguard says its recommendation rests on “the more likely scenarios between the 25th and 75th percentiles”; its retail page compresses that into “it’s wise to invest a lump sum immediately.” That is Vanguard’s recommendation, reported here as Vanguard’s, and none of this research speaks to paycheck 401(k) contributions.
Selling near retirement is a different problem
This is where the advice genuinely diverges, and where no US regulator has published a definition we could find. FINRA’s page on risk enumerates nine kinds — market, business, political, currency, liquidity, concentration, inflation, systemic and non-systemic — and sequence risk is not among them. The definition we verified comes from the Financial Analysts Journal, Fourth Quarter 2017: “the risk of experiencing bad investment outcomes at the wrong time,” because “it is not just long-term average investment returns but when those returns are earned that determines a decumulating investor’s wealth.”
The word doing the work is “decumulating.” Someone still contributing and someone selling shares every month to pay bills face the same market and a different problem. FINRA’s illustration on that same page: “If you had planned to retire in the 2008 to 2009 timeframe — when stock prices dropped by 57 percent — and had the bulk of your retirement savings in stocks or stock mutual funds, you might have to reconsider your retirement plan.” Target-date funds are the standard institutional answer, and the SEC’s investor bulletin of March 25, 2025 is blunt about the limits: they “do not guarantee that you will have sufficient retirement income, or a specific level of retirement income, at or after the target date.”
The behavior gap is contested by a factor of twelve
The figure usually deployed to prove selling is costly is the behavior gap. It is the subject of an open academic dispute.
| Study | Publisher | Finding |
|---|---|---|
| Mind the Gap 2025 (Aug 13, 2025) | Morningstar — sells data and research | Average dollar in US funds and ETFs earned 7.0%/yr vs 8.2% aggregate total return, 10 years to Dec 31, 2024 — a 1.2 pp gap |
| Mind the Gap 2025, by trading activity | Morningstar | Gap ran from -0.8%/yr for the least-traded quintile to -1.8% for the most-traded |
| Fulkerson, Jordan, Riley & Yan (May 12, 2026) | Financial Analysts Journal — peer-reviewed | Using the same sample, poor timing costs investors 0.10% per year |
Roughly a twelvefold difference on identical data. We cannot adjudicate it, and neither can anyone quoting the 1.2% figure as established. Note the asymmetry of interest: Morningstar sells data and advice; the FAJ authors are academics in a peer-reviewed journal.
What nobody publishes
No study we could obtain measures what selling in a past bear market cost the people who sold. The FINRA Foundation survey measures whether people traded, not what it cost them. Vanguard’s 2026 recordkeeping data, covering nearly five million workers in the plans it administers, reports “only 5% of participants traded during periods of volatility” — administrative data rather than self-report, but Vanguard’s own auto-enrolled 401(k) book, not all US investors.
One further FINRA Foundation finding is worth sitting with. Asked outright, 42% said they were willing to take less financial risk than before the 2020 volatility. Measured against the same panel’s 2018–2019 answers on an objective four-item scale, 62% showed no change and only 12% showed lower risk tolerance. People report feeling more cautious than their behavior indicates.
The short version
1. Check which definition a headline is using. The SEC requires 20% over at least two months; FINRA and S&P require only the 20%. 2. Separate “do I need this money soon” from “should I sell.” Conflating them is how forced sales happen — see how much emergency fund you actually need and where to hold short-term cash. 3. Write down the calendar date you need each dollar. Sequence-of-returns risk applies to money being withdrawn, not money left alone, which is why the near-retirement case genuinely differs. 4. Ask whether a return figure is a price index or a total return. Wells Fargo’s 8.4% excludes dividends, by its own disclosure. 5. Treat any undated figure as unusable; best-days statistics are frozen at their publisher’s chosen window. 6. Discount any claim that averaging in protects an existing portfolio. It is a decision about new cash only. 7. Ignore recovery-time averages and bear-market counts unless the source shows its series. We could not verify either.
CentSheet publishes educational content, not personalized financial advice. Nothing here is a recommendation to buy, sell or hold any security, fund or strategy.
Get the CentSheet Money Brief
Email me CentSheet weekly: practical money decisions, new calculators, and useful worksheets. Unsubscribe anytime.