Three funds tracking the S&P 500 charge 0.015%, 0.03% and 0.0945% a year. Fidelity’s 500 Index Fund (FXAIX) is the first, and Fidelity states it in dollars on its own page: $0.15 per $1,000 a year, as of April 29, 2026. State Street’s SPDR S&P 500 ETF Trust (SPY) is the last, at 0.0945% as of August 6, 2026 — roughly three times the 0.03% iShares and Vanguard publish for their S&P 500 funds.
“Low cost” is not a property of index funds as a category. It is a number attached to one fund, on one date, and you have to go get it. If this is your first fund, start with index funds for beginners.
The expense ratio is deducted, not billed
The SEC defines the expense ratio as “Total Annual Fund Operating Expenses (Expressed as a % of the fund’s average net assets).” FINRA describes it as the share of a fund’s total assets “that goes toward paying its recurring fees every year,” found in the prospectus.
The mechanism matters more. From the SEC’s July 23, 2025 fee bulletin: “When fund fees are paid out of fund assets, the value of the fund decreases and the value of all the investors’ shares decreases.”
There is no invoice. No line appears on your statement. The fund’s net asset value is simply lower than it would have been, every day, forever. That is not a scandal — it is how the vehicle is built — but it is why fee comparison is a thing you do before you buy, not something you notice later. The SEC’s summary of the consequence: “A fund with higher costs must perform better than a lower-cost fund to generate the same returns for you.”
What the large index funds actually charge
All figures are from each issuer’s own pages, retrieved August 6, 2026. We are not ranking or recommending any of them.
| Fund | Ticker | Expense ratio | Ratio as of |
|---|---|---|---|
| Fidelity ZERO Total Market Index | FZROX | 0.00% | 2025-12-30 |
| Fidelity 500 Index | FXAIX | 0.015% | 2026-04-29 |
| Fidelity Total Market Index | FSKAX | 0.015% | 2026-04-29 |
| Schwab S&P 500 Index | SWPPX | 0.020% | 2026-08-06 |
| Schwab Total Stock Market Index | SWTSX | 0.030% | 2026-08-06 |
| Vanguard S&P 500 ETF | VOO | 0.03% | 2026-04-28 |
| Vanguard Morningstar Total Stock Market ETF | VTI | 0.03% | 2026-04-28 |
| iShares Core S&P 500 ETF | IVV | 0.03% | current prospectus |
| iShares Core S&P Total U.S. Stock Market ETF | ITOT | 0.03% | current prospectus |
| Vanguard 500 Index Admiral | VFIAX | 0.04% | 2026-04-28 |
| Vanguard Morningstar Total Stock Market Index Admiral | VTSAX | 0.04% | 2026-04-28 |
| SPDR S&P 500 ETF Trust | SPY | 0.0945% | 2026-08-06 |
VOO and VFIAX are two share classes of the same fund, priced one basis point apart — Vanguard’s VOO page notes it is “Also available as an Admiral Shares mutual fund.” Same for VTI and VTSAX; Vanguard reports fund total net assets of $2.3 trillion against $663.5 billion for the VTI share class, as of June 30, 2026.
Vanguard renamed its U.S. equity index funds effective July 29, 2026, after Morningstar rebranded the CRSP indexes; VTI now states its objective as tracking the Morningstar US Total Market Index. Vanguard says the change “will not affect the funds’ investment objectives or how they are managed.” Much of the writing online still names the old index.
Minimums do not split the way people assume. Fidelity and Schwab index mutual funds show $0 or “No minimum”; Vanguard’s Admiral shares require $3,000. FINRA’s general framing: mutual funds typically require $500–$3,000, while “the entry price for ETFs is the cost of a share (or even a fractional share).”
FZROX shows 0.00%. It also tracks Fidelity’s own proprietary index rather than a third-party one, and whether that matters depends on things we did not verify — including what moving such a position to another brokerage involves.
The costs the expense ratio does not include
The bid-ask spread. The SEC calls it plainly: “The spread can be thought of as a hidden cost to investors since spreads reduce potential returns” (February 2023 bulletin). Under SEC Rule 6c-11, ETFs relying on the rule must publish a 30-day median bid-ask spread on their websites each business day. As of August 5, 2026: SPY 0.00%, IVV 0.01%, ITOT 0.01%, VOO 0.01%. Those are rounding errors at these sizes. We verified no spreads for thinner or niche ETFs, so do not carry these numbers to a fund we have not named.
Premium and discount to NAV. ETF shares trade at market prices, not NAV. On August 5, 2026 VOO’s market price was $707.60 against a NAV of $707.72 — a 0.02% discount. It runs both ways: SPY’s Rule 6c-11 table shows 123 premium days against 127 discount days in calendar 2025.
Commissions. State Street’s SPY page: “Ordinary brokerage commissions apply.” The SEC notes ETFs “generally do not charge fees directly to investors,” but that “there may be other types of transaction fees and costs, such as commissions paid to a broker.”
Loads, 12b-1 fees and account fees. These are mutual fund costs charged directly to you. FINRA says front-end loads run “between 2 percent and 5 percent” and that 12b-1 fees are “capped at 1 percent of your assets in the fund.” The SEC notes 12b-1 fees “typically apply to mutual funds but not to ETFs.” The only 12b-1 figure we verified above is FXAIX’s, at 0.00%.
Advice and platform layers. We have no verified figure for what an advisor or platform charges on top of a fund, so we are not publishing one. The structural point holds anyway: an annual percentage fee compounds identically whoever collects it — fund, custodian or adviser.
Tax drag is larger than any of these ratios
Issuers publish after-tax returns, and the gap dwarfs the expense ratio. As of June 30, 2026, iShares reported IVV’s 10-year average annual return at 15.47% before tax, 15.01% after tax on distributions, and 12.95% after tax on distributions and sale of shares. State Street reported SPY at 15.35%, 14.91% and 12.85% on the same three bases.
By our subtraction of the issuers’ own figures, the pre-tax to after-tax-on-distributions gap is 0.46 percentage points a year for IVV and 0.44 for SPY — far larger than either fund’s expense ratio. The issuers state the assumptions: highest individual federal marginal rates, no state or local tax, and no relevance at all to tax-deferred accounts. These are trailing figures as of a stated date, not forecasts.
The obvious next move is to conclude ETFs beat index mutual funds on tax. The current data does not support that for broad index funds. IVV’s ten most recent distributions, from March 2024 through June 2026, carried $0.000000 in short- and long-term capital gains. But Fidelity’s FXAIX — a plain mutual fund with no ETF share class — lists its most recent capital gains distribution as April 5, 2019. Turnover across these funds runs 2.00% to 3.49% (FXAIX 2.00% as of 08/31/2025; SWTSX 3.49% as of 06/30/2026). A fund that barely trades has little to distribute regardless of its wrapper.
The arithmetic of a fee that never stops
The SEC publishes its own illustration: a $100,000 investment growing 4% annually over 20 years, under three different annual fees.
| Annual fee | Portfolio value after 20 years |
|---|---|
| 0.25% | ~$208,000 |
| 0.50% | ~$198,000 |
| 1.00% | ~$179,000 |
The SEC does not state the difference between those endpoints, so neither will we. Its conclusion is the qualitative one: “Over time, even small ongoing fees have a big impact on your investment portfolio.”
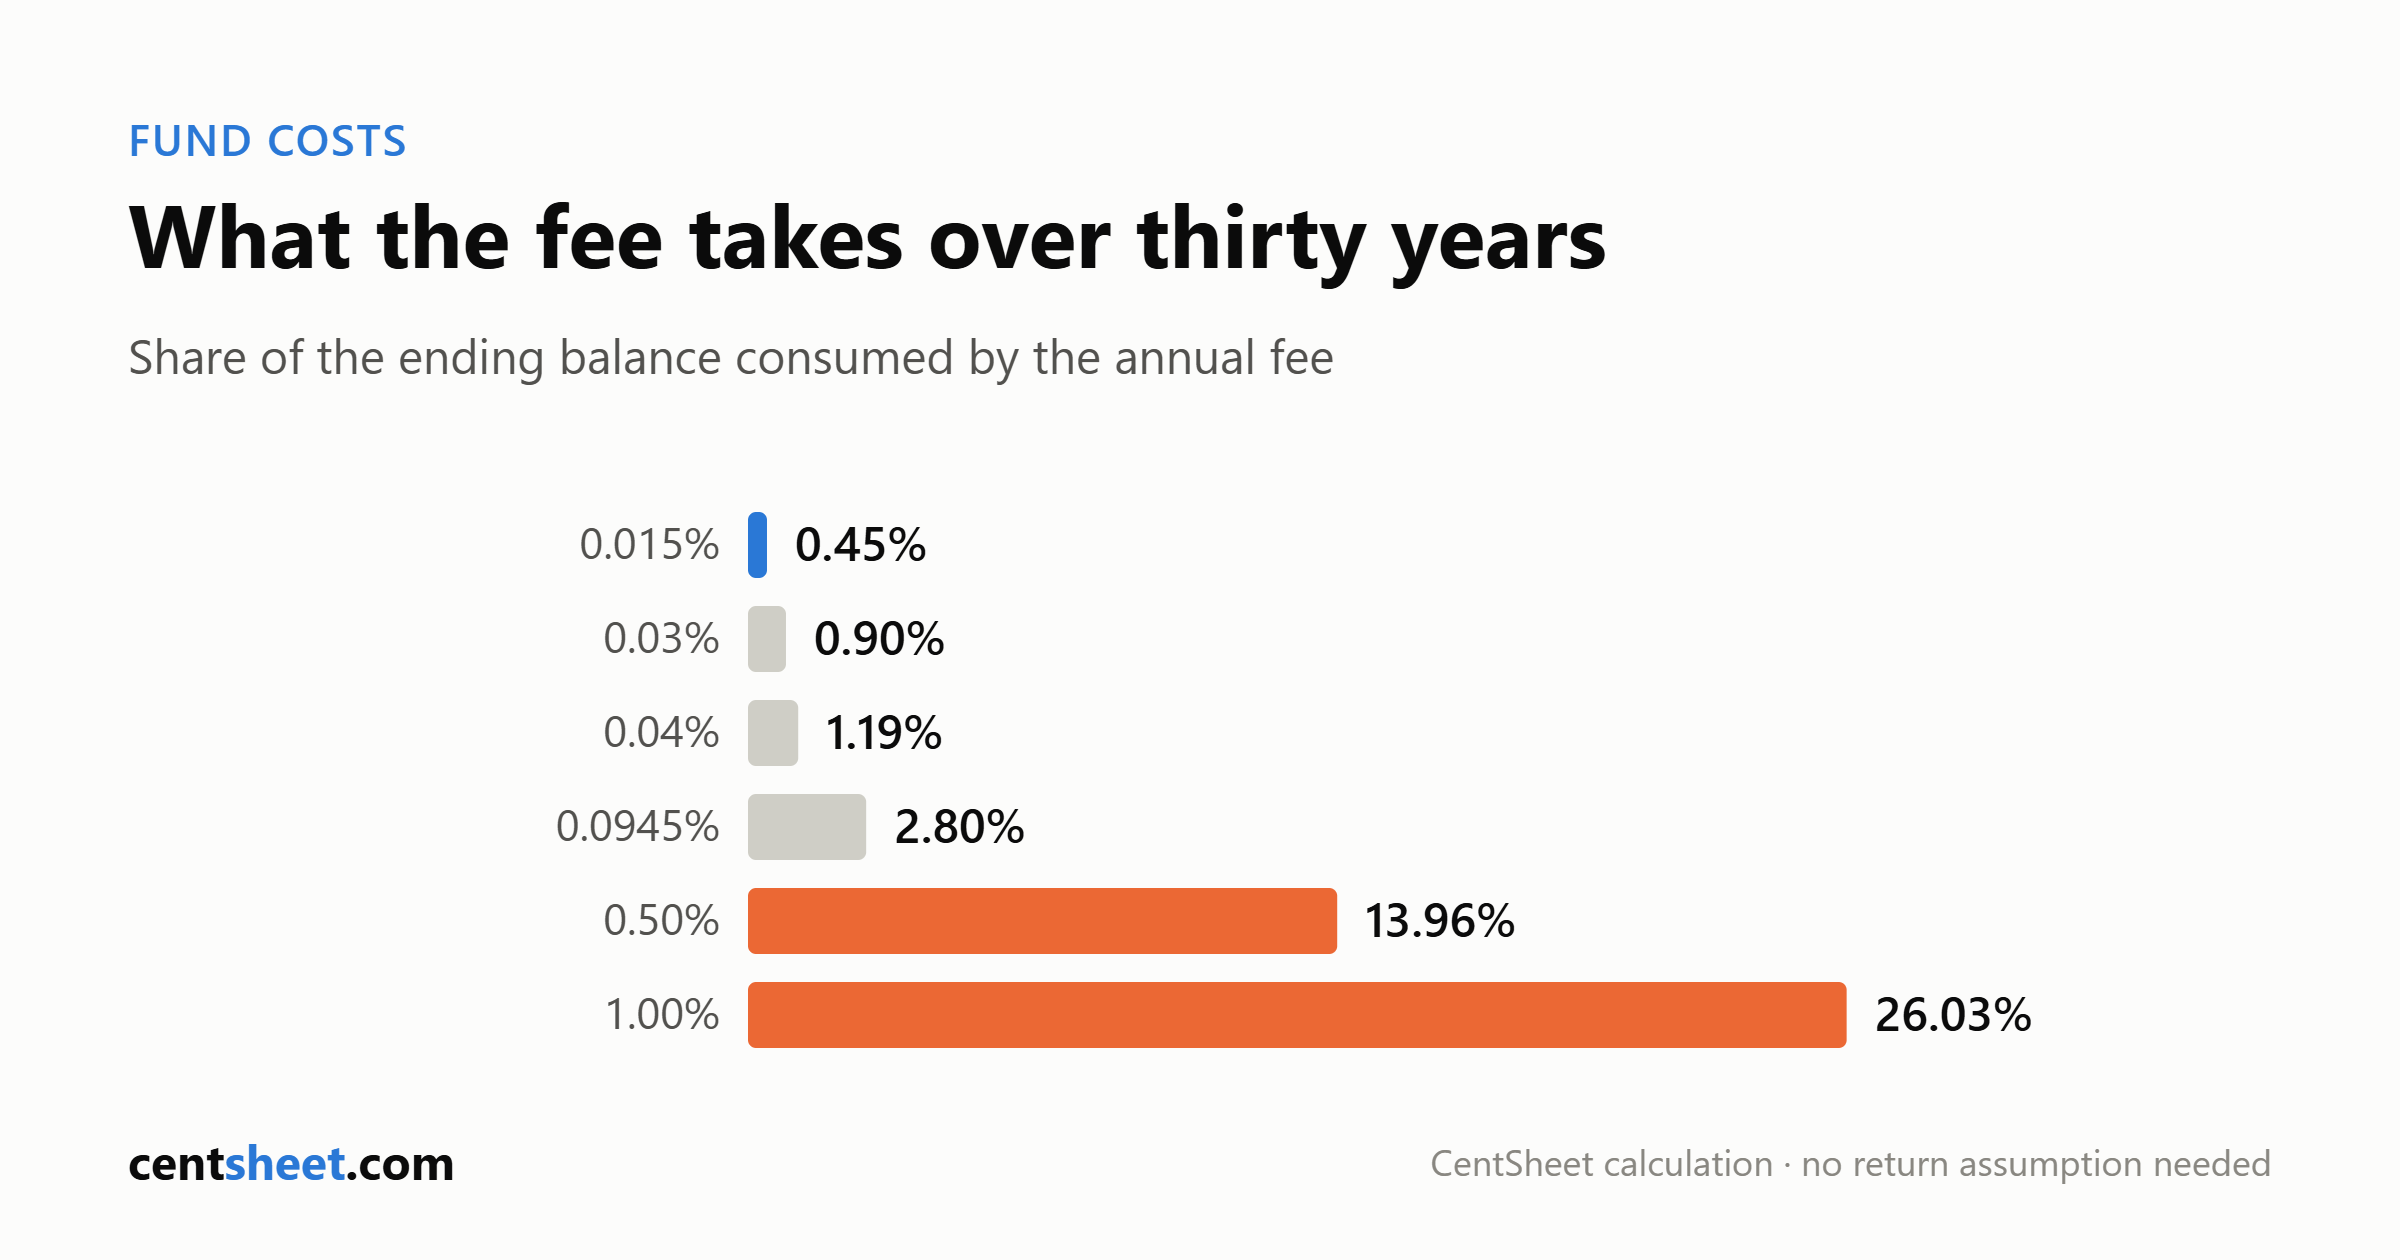
Here is the same idea without a return assumption. A percentage fee taken each year multiplies the ending balance by (1 − fee). That drag is the same fraction whatever the market does — good decade or bad. Over 30 years:
| Annual fee | Share of the ending balance the fee has taken after 30 years |
|---|---|
| 0.015% | 0.45% |
| 0.03% | 0.90% |
| 0.04% | 1.19% |
| 0.0945% | 2.80% |
| 0.50% | 13.96% |
| 1.00% | 26.03% |
That table is CentSheet’s calculation, not any issuer’s or regulator’s. Assumptions: a lump sum held 30 years with no additions or withdrawals; the fee applied once annually to the whole balance rather than accrued daily; no assumption about investment return, because the drag is multiplicative and cancels out of the ratio; taxes, spreads and commissions excluded. Run your own version in our compound interest calculator; compound interest in real numbers covers why the last two rows behave so differently from the first four.
The shape of that table is the argument. Moving from 0.04% to 0.03% changes the ending balance by about 0.30% over 30 years, by the same calculation. Moving from 1.00% to 0.03% is another order of magnitude.
Where the ratio shows up in returns
Fee drag is observable in published tracking data, within a single issuer on a single date.
Vanguard, month-end as of July 31, 2026: VFIAX (the 0.04% mutual fund share class) returned 15.04% annualized over 10 years; VOO (the 0.03% ETF share class of the same fund) returned 15.04% at NAV and 15.05% at market price, against a benchmark at 15.08%. Two share classes, identical to two decimal places.
iShares, quarter-end as of June 30, 2026: IVV returned 15.47% at NAV against a benchmark iShares reports at 15.50% — a shortfall of 0.03 percentage points a year, exactly its expense ratio. State Street, same quarter-end: SPY returned 15.35% at NAV against a benchmark State Street reports at 15.51%, a shortfall larger than its 0.0945% ratio. SPY is a unit investment trust, which its own page states and which puts it outside Rule 6c-11. We did not verify the mechanism behind the larger shortfall, so we are not asserting one.
The two issuers also disagree on the benchmark itself. Same index, same June 30, 2026 date: State Street reports the S&P 500’s 10-year return at 15.51%, BlackRock at 15.50%. One basis point, almost certainly rounding or a series difference — but there is no neutral number here, and averaging the two would invent one.
Do not read the Vanguard figures against the iShares and State Street ones — the as-of dates differ, and that alone moves a trailing average. All of this is historical, and every issuer page carries the standard warning that past performance does not guarantee future results.
What to actually do
1. Get the expense ratio from the fund’s own page or prospectus, and write down the as-of date next to it. Every figure in this article has one for a reason. 2. Convert it to dollars on your actual balance. Fidelity does it for you at 0.015% — $0.15 per $1,000 — and the same one-line arithmetic works on any ratio. 3. Run the comparison in FINRA’s Fund Analyzer, which takes up to three funds, your investment amount and your holding period, and compares each fund’s operating expense ratio to the average for similar funds. 4. If you are buying an ETF, check the published 30-day median bid-ask spread on the issuer’s site. For the funds above it was 0.00%–0.01% as of August 5, 2026. For anything thinner, look it up rather than assuming. 5. Check the fund’s own capital-gains distribution history, not its structure. 6. Count every annual percentage layer you pay — fund, platform, advice. They compound the same way, and the fund’s is usually the smallest. 7. Stop optimizing below about a basis point. That is not where the money is.
CentSheet publishes educational content, not personalized financial advice. Nothing here is a recommendation of any fund, issuer or brokerage, and nothing here is tax advice.
Get the CentSheet Money Brief
Email me CentSheet weekly: practical money decisions, new calculators, and useful worksheets. Unsubscribe anytime.