Author: Vinoth Kanna

  • The Paycheck-to-Paycheck Exit Sequence: Order of Operations, Not Willpower

    The Paycheck-to-Paycheck Exit Sequence: Order of Operations, Not Willpower

    Living paycheck-to-paycheck has a precise definition that matters more than the vibe: your timing has no slack. Rent is due on the 1st; the paycheck lands on the 1st. One delay, one surprise, one short check, and the month collapses into fees and borrowed money.

    The exit isn’t a heroic act of frugality. It’s a sequence — five steps in a deliberate order, each one making the next possible. People fail mostly by attempting step four first.

    Step 0: Stop the bleeding before optimizing anything

    Before budgets, before savings: eliminate the compounding leaks — overdraft fees, late fees, minimum-payment-only cards quietly growing. A single overdraft fee can erase a week of careful grocery savings.

    Concretely: turn off overdraft “protection” that approves transactions into negative balances; move due dates (one phone call, usually) so bills cluster just after payday instead of just before; and check whether any card’s minimum even covers its interest. This step costs nothing and is pure arithmetic.

    Step 1: Know your survival number

    You cannot build slack against an unknown. Add up the bare month — housing, utilities, food, insurance, minimum debt payments, transport. From the emergency-fund framework: that’s your survival number, and for this article’s running example we’ll use $3,400.

    Most people doing this for the first time discover they didn’t know the number within $500. The discovery is the point — a short zero-based month is the fastest way to find it and the leaks at the same time.

    Step 2: Build the half-month buffer — the actual exit door

    Here’s the mechanical heart of the sequence, and the part most advice skips straight past on the way to “six months of expenses.”

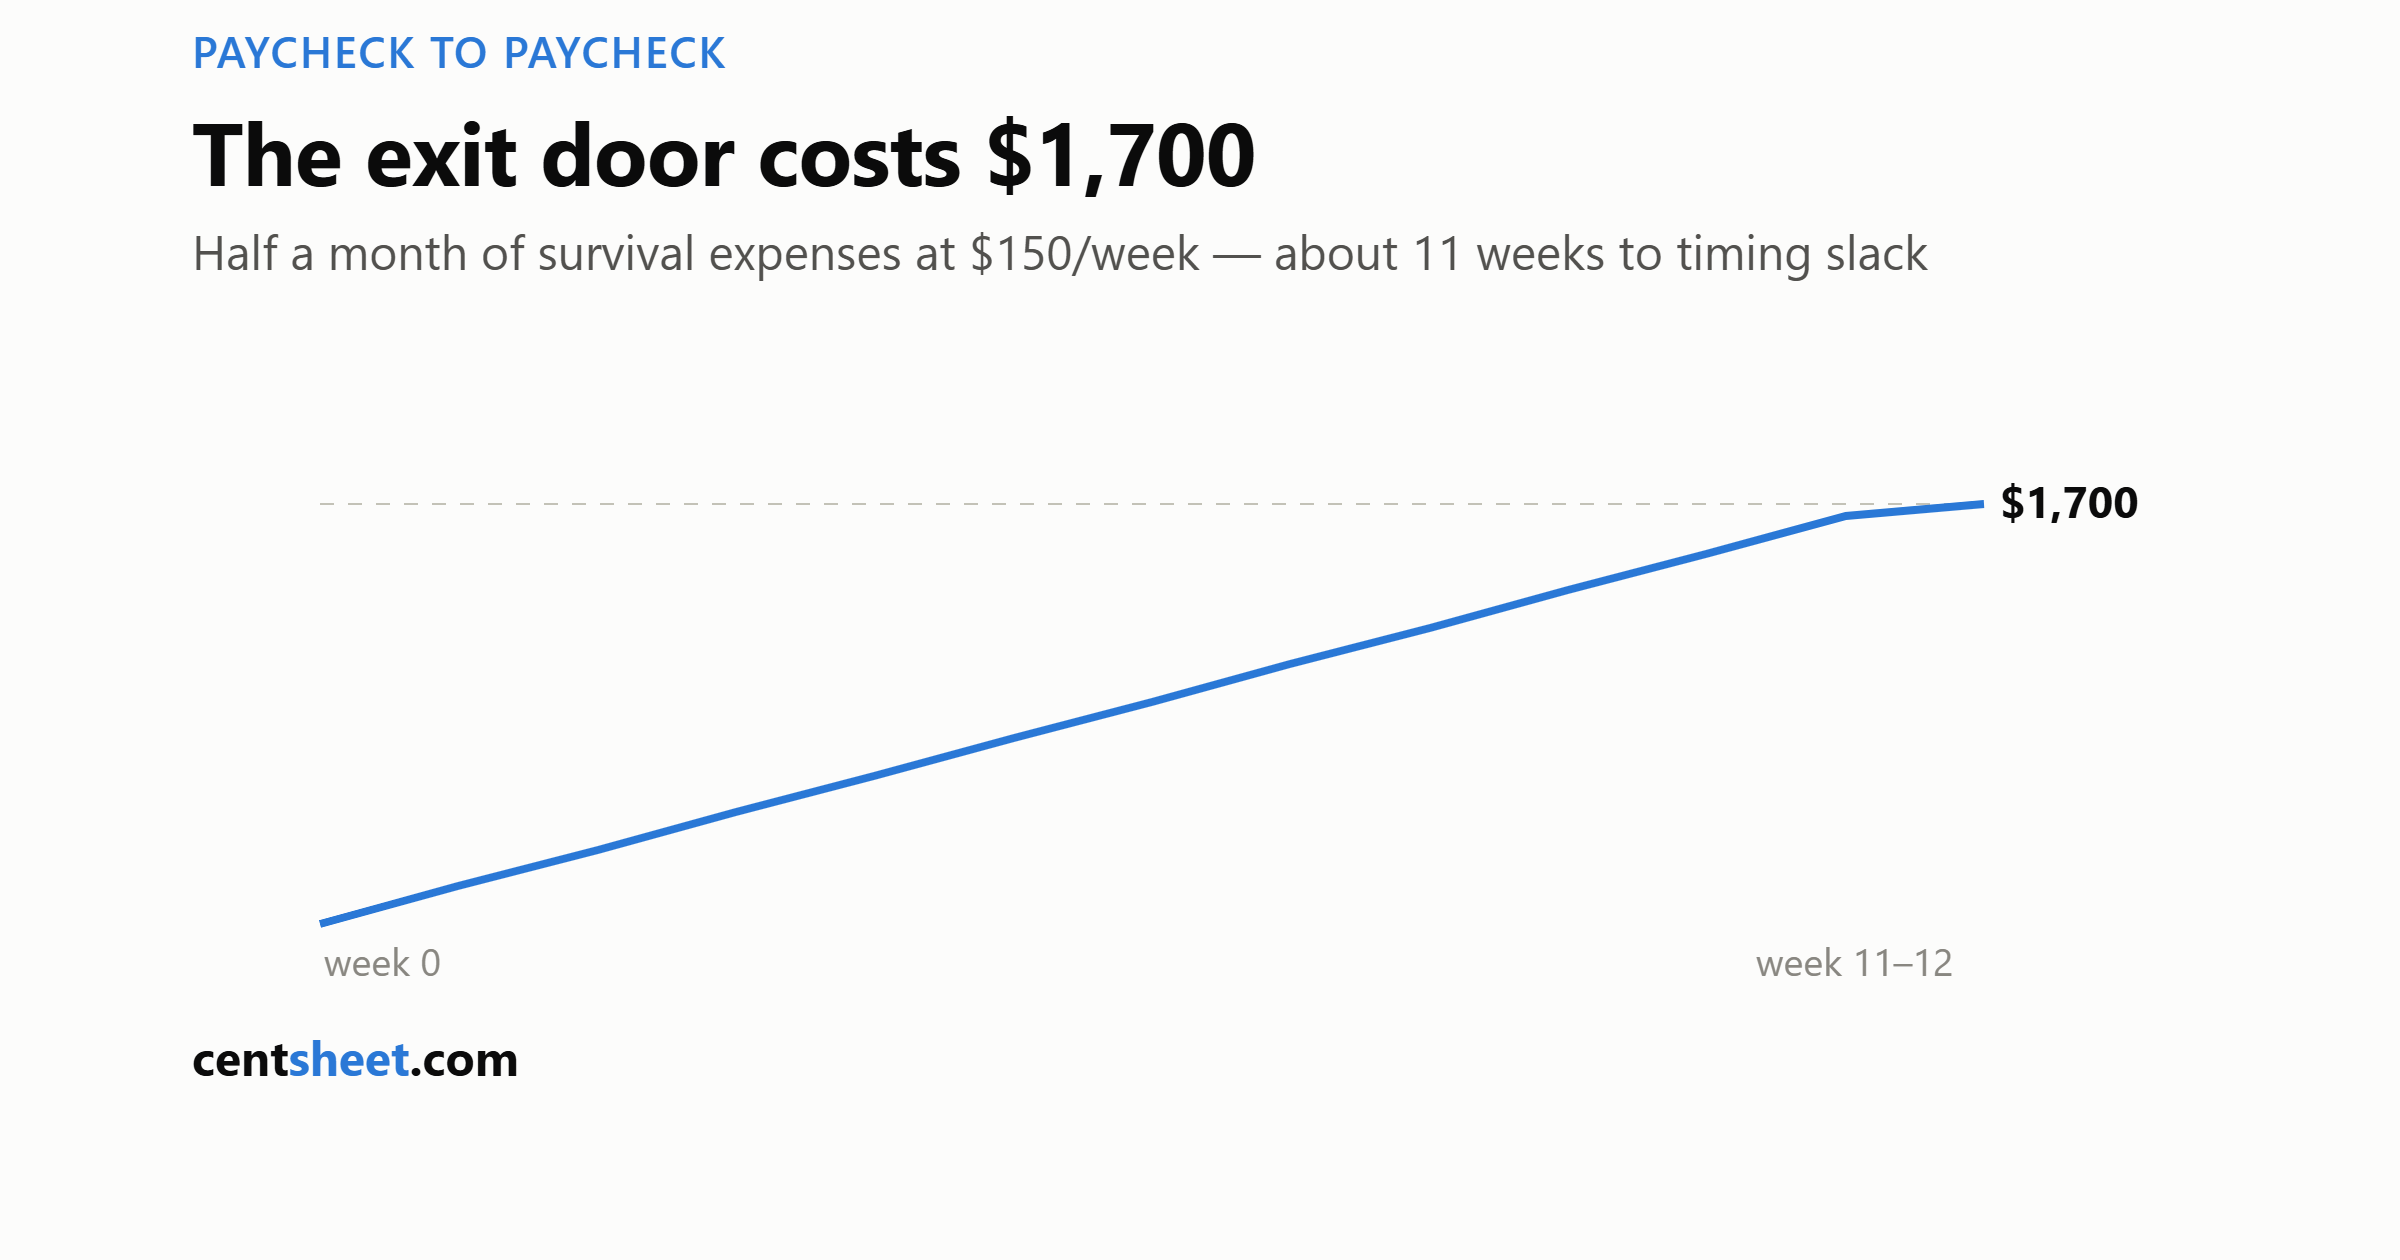
    The thing that breaks paycheck-to-paycheck life isn’t the absence of a big emergency fund. It’s the absence of timing slack — money that lets this month’s bills be paid from last month’s income. The minimum viable version is roughly half a month of survival expenses: for our $3,400 example, $1,700.

    At $150/week, that’s about 11 weeks to fundamentally different finances: due dates stop mattering, a delayed paycheck is an annoyance instead of a crisis, and the overdraft cycle from Step 0 becomes structurally impossible.

    Where does $150/week come from at this income? Steps 0’s recovered fees, a bill-audit day (a typical household finds $60+/month there), and the leak list from Step 1. This is why the order matters — each earlier step funds this one.

    Park the buffer in a separate accountan HYSA, not your checking. Visibility in checking is how buffers evaporate.

    Step 3: Break the debt-minimum treadmill

    With timing slack in place, surplus becomes real for the first time — and its highest and best use is almost always the highest-interest debt, avalanche or snowball, your pick. A card at 24% APR is a guaranteed negative return no savings account can outrun.

    The sequencing logic, stated plainly: the buffer comes before aggressive debt payoff for the same reason the $1,000 starter fund does — without slack, the first surprise goes straight back on the card and undoes months of progress. With slack, progress compounds.

    Step 4: Automate the escape so it survives you

    Willpower got you through eleven weeks; don’t budget willpower for eleven years. On payday, automatically: buffer top-up (until full), then extra debt payment, then sinking funds. What reaches checking is genuinely spendable — the system runs the plan so a bad week can’t.

    From here, the rest of personal finance opens up in order: full emergency fund, then investing, where time does the heavy lifting.

    The honest caveat

    Everything above assumes the arithmetic can close — that income minus survival expenses leaves something, however small, to redirect. For a real share of households it doesn’t, and no sequence fixes a structural gap; as we said about the 50/30/20 rule, needs at 70%+ of income is a cost or income problem, not a discipline problem. If that’s the situation, the honest priorities are the structural ones — housing cost, income, benefits you may be entitled to — and no budgeting article should pretend otherwise.

    The sequence on one line

    Stop the fees → learn the number → half-month buffer ($1,700 here, ~11 weeks at $150) → kill the expensive debt → automate it. Slack first, heroics never.


    CentSheet publishes educational content, not personalized financial advice.
  • How to Actually Negotiate a Bill (Scripts Included)

    How to Actually Negotiate a Bill (Scripts Included)

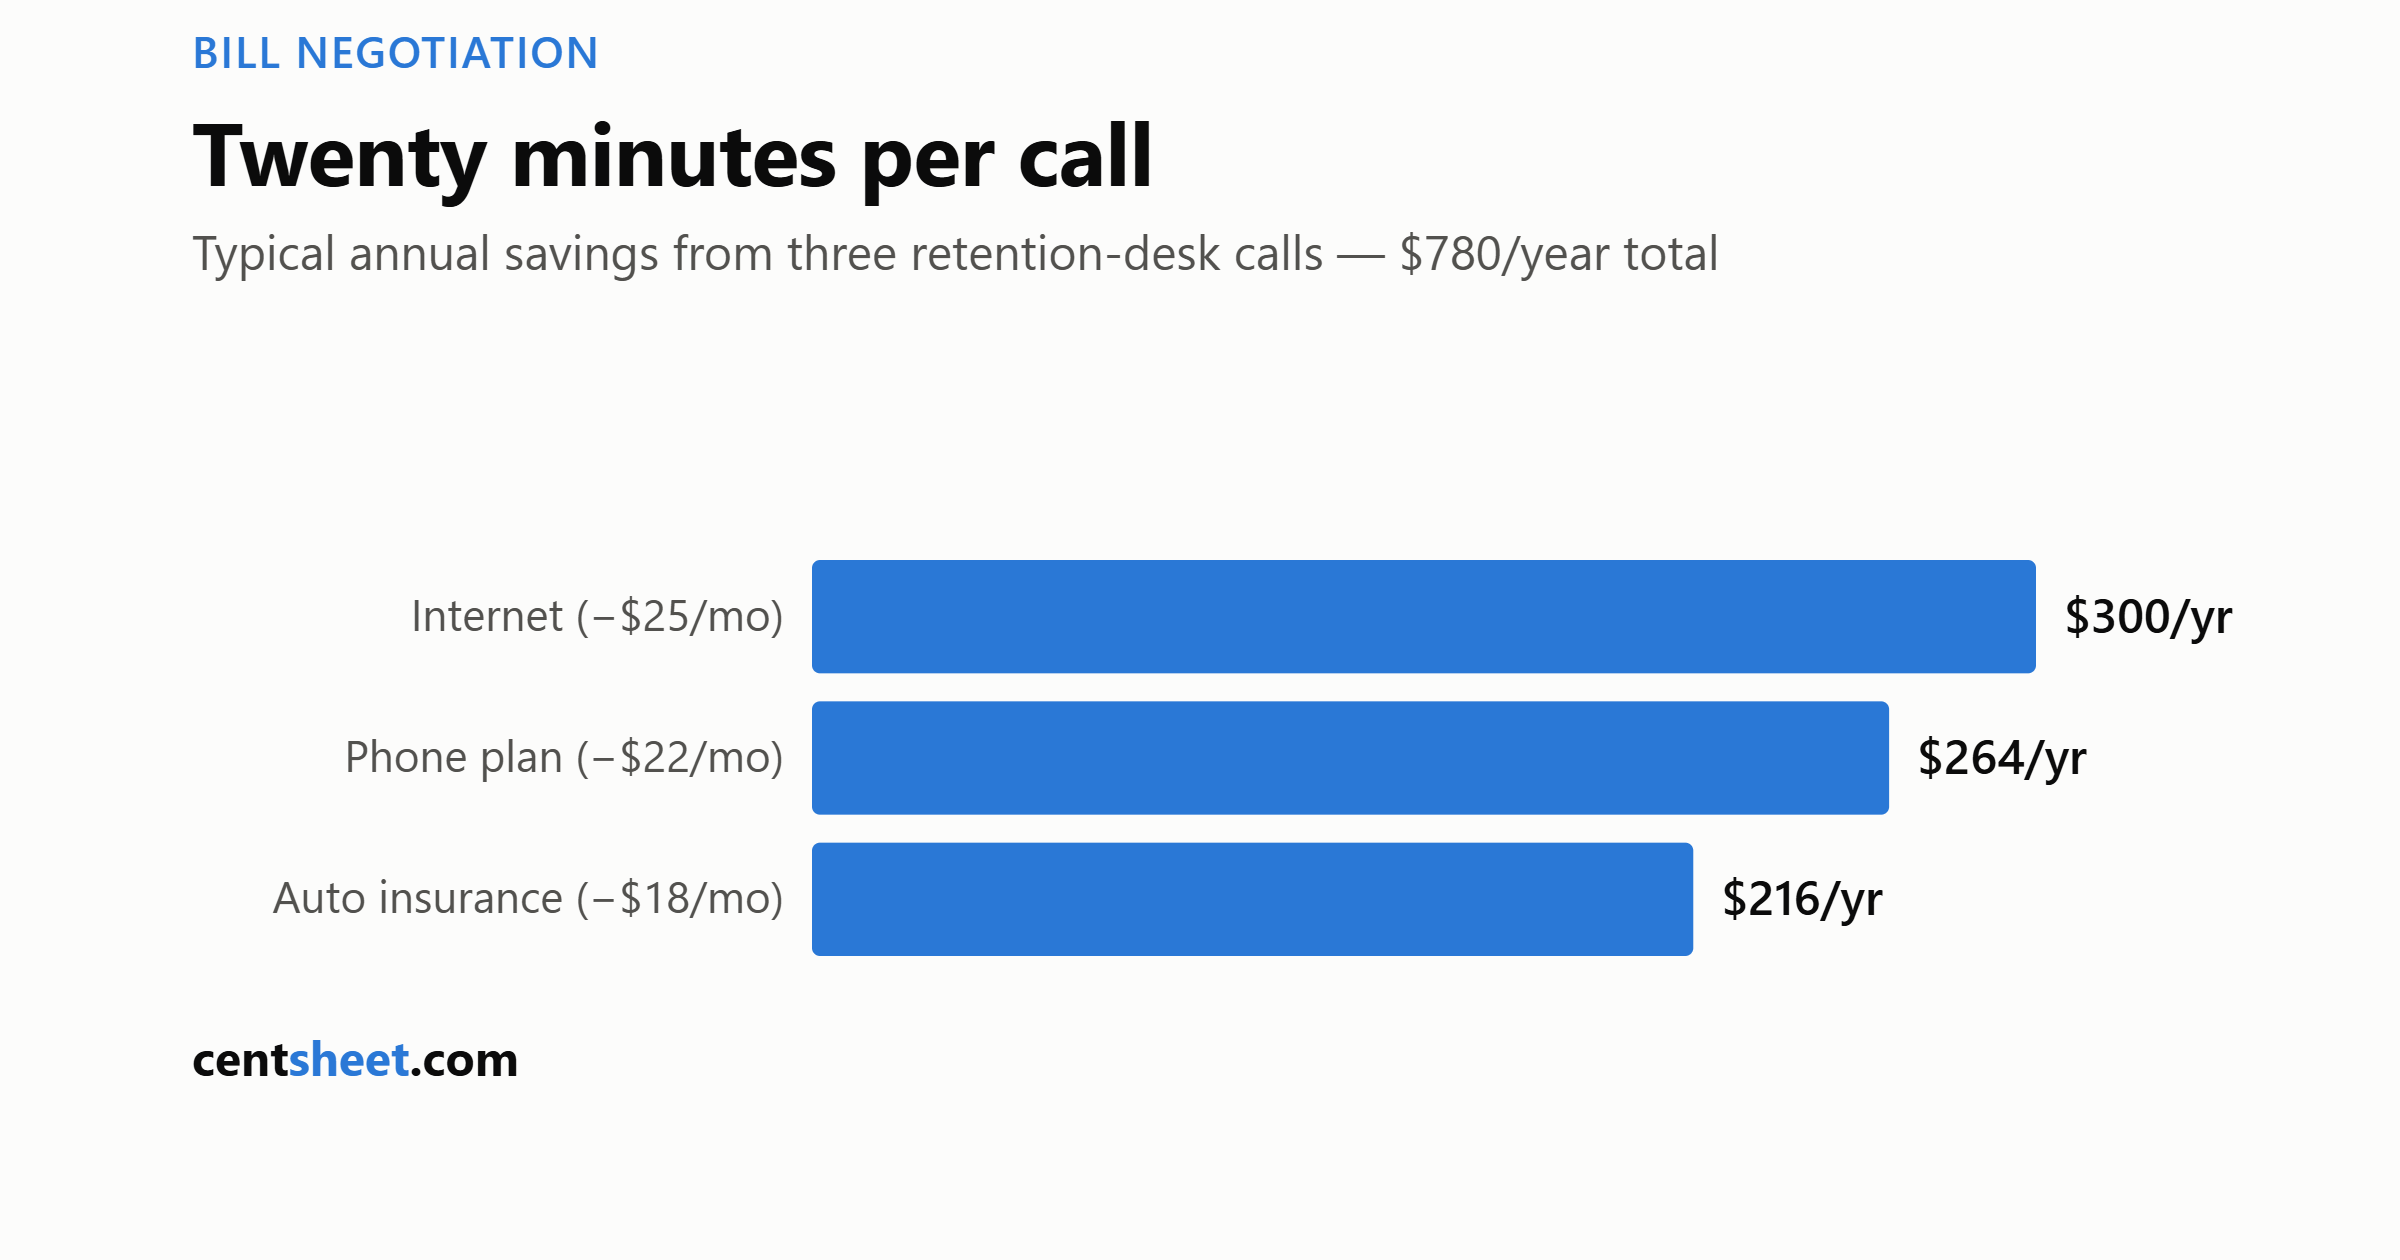
    Budget advice loves the coffee lecture: give up small pleasures, save small money. Meanwhile three of your recurring bills are quietly overpriced, the companies charging them have retention departments whose entire job is to give discounts to people who ask — and asking takes twenty minutes.

    Cut $25 off internet, $18 off insurance, and $22 off a phone plan and you’ve found $780 a year — every year, without giving up anything. That’s the math case. Here’s the how.

    The three rules that make every script work

    1. Retention, not billing. Front-line agents can’t discount much. The phrase “I’m thinking about canceling my service” routes you to the retention department, which can. You’re not threatening anyone; you’re navigating a menu.

    2. Have the competitor’s number in front of you. “Your competitor offers X for $Y” is the whole negotiation. It works because it’s checkable and because retention agents are often scored on saves, not margin.

    3. Be pleasant, be patient, be willing to be transferred. The person on the phone didn’t set the price. Courtesy plus persistence outperforms aggression every time, and the agent has discretion you want on your side.

    Internet & cable — the softest target

    New-customer promo pricing expires and your rate drifts up; the gap between your rate and the current promo is your negotiating room.

    “Hi — I’ve been a customer for [X years]. My bill has gone from $[old] to $[current], and [competitor] is offering [speed] for $[price]. I’d like to stay, but I need my rate to be competitive. What can you do?”

    If the first answer is nothing: “I understand — could you transfer me to retention?” If retention offers nothing: genuinely consider the competitor, because that price gap is real money. Calendar-note the new promo’s end date; this is an annual ritual, not a one-time fix.

    Auto & home insurance — negotiate by re-shopping

    Insurers rarely haggle on a quoted premium; the leverage is a competing quote. Re-quote your coverage every renewal (comparison sites or an independent agent make it a 20-minute job), then call your current insurer:

    “My renewal came in at $[X]. I have a quote from [competitor] for the same coverage at $[Y]. Before I switch, is there anything you can do — discounts I’m not getting, or a re-rate?”

    Also ask directly about discount audits: bundling, low-mileage, payment-in-full, defensive-driving. Loyalty is not a pricing strategy — in some markets long-tenured customers pay more, not less.

    Phone plans — the MVNO card

    The big carriers’ retention offers exist, but the stronger play is knowing that MVNOs (budget carriers that rent the same networks) run dramatically cheaper for identical coverage. The script writes itself:

    “My plan costs $[X]. [MVNO] runs on your network for $[Y]. Can you match it, or should I move the number?”

    Either answer wins: they match, or you port out and keep the difference.

    Medical bills — a different game entirely

    Medical billing is negotiable in ways people don’t expect, and the stakes are larger. Two structural facts help you: you can always request an itemized bill, and US federal rules for nonprofit hospitals (the 501(r) requirements) oblige them to maintain written financial-assistance policies.

    • Always request an itemized bill. Errors are common; charges sometimes shrink under inspection alone.
    • Ask about financial assistance. Nonprofit hospitals maintain assistance policies with income thresholds meaningfully higher than people assume.
    • Ask for the cash/prompt-pay discount, and if the number is still impossible, ask for an interest-free payment plan — often granted for the asking.
    • Never put a large medical bill on a credit card before exhausting the above; you’d be converting a negotiable, often-interest-free debt into a non-negotiable one at 24%.

    Subscriptions — negotiate by leaving

    Streaming and software rarely haggle live, but the cancel-flow is a pricing tier: start canceling and a retention offer frequently appears. If it doesn’t, finish the cancellation — the resubscribe promo a month later is the same discount with extra steps.

    Make it a system, not a story

    One save is an anecdote; the yield comes from the ritual. Put a recurring “bill audit day” on the calendar — twice a year, an hour — walk the list, make the calls. Route every dollar saved somewhere deliberate (a sinking fund or the debt snowball), because a discount that dissolves into general spending might as well not exist.


    CentSheet publishes educational content, not personalized financial advice. Offers, departments and policies vary by company and change often.
  • HYSA vs. CD vs. T-Bills: The After-Tax Math Most Comparisons Skip

    HYSA vs. CD vs. T-Bills: The After-Tax Math Most Comparisons Skip

    Every “best savings rates” comparison ranks by headline APY. Almost none of them mention the variable that can reorder the entire list: taxes — specifically, that interest from US Treasury bills is exempt from state and local income tax, while bank interest isn’t.

    If you live in a state with an income tax, the lower headline rate sometimes wins. Here’s the actual arithmetic.

    The three vehicles in one paragraph each

    High-yield savings account (HYSA): a bank account paying a competitive floating rate. Fully liquid, FDIC-insured, rate can change any day. The default home for an emergency fund.

    Certificate of deposit (CD): you lock money at a bank for a fixed term at a fixed rate. FDIC-insured; leaving early costs a penalty, typically several months of interest.

    Treasury bills: short-term US government debt (4 to 52 weeks), bought at a discount through a brokerage or TreasuryDirect. Backed by the federal government, and — the part that matters here — interest is exempt from state and local income tax.

    The math nobody runs

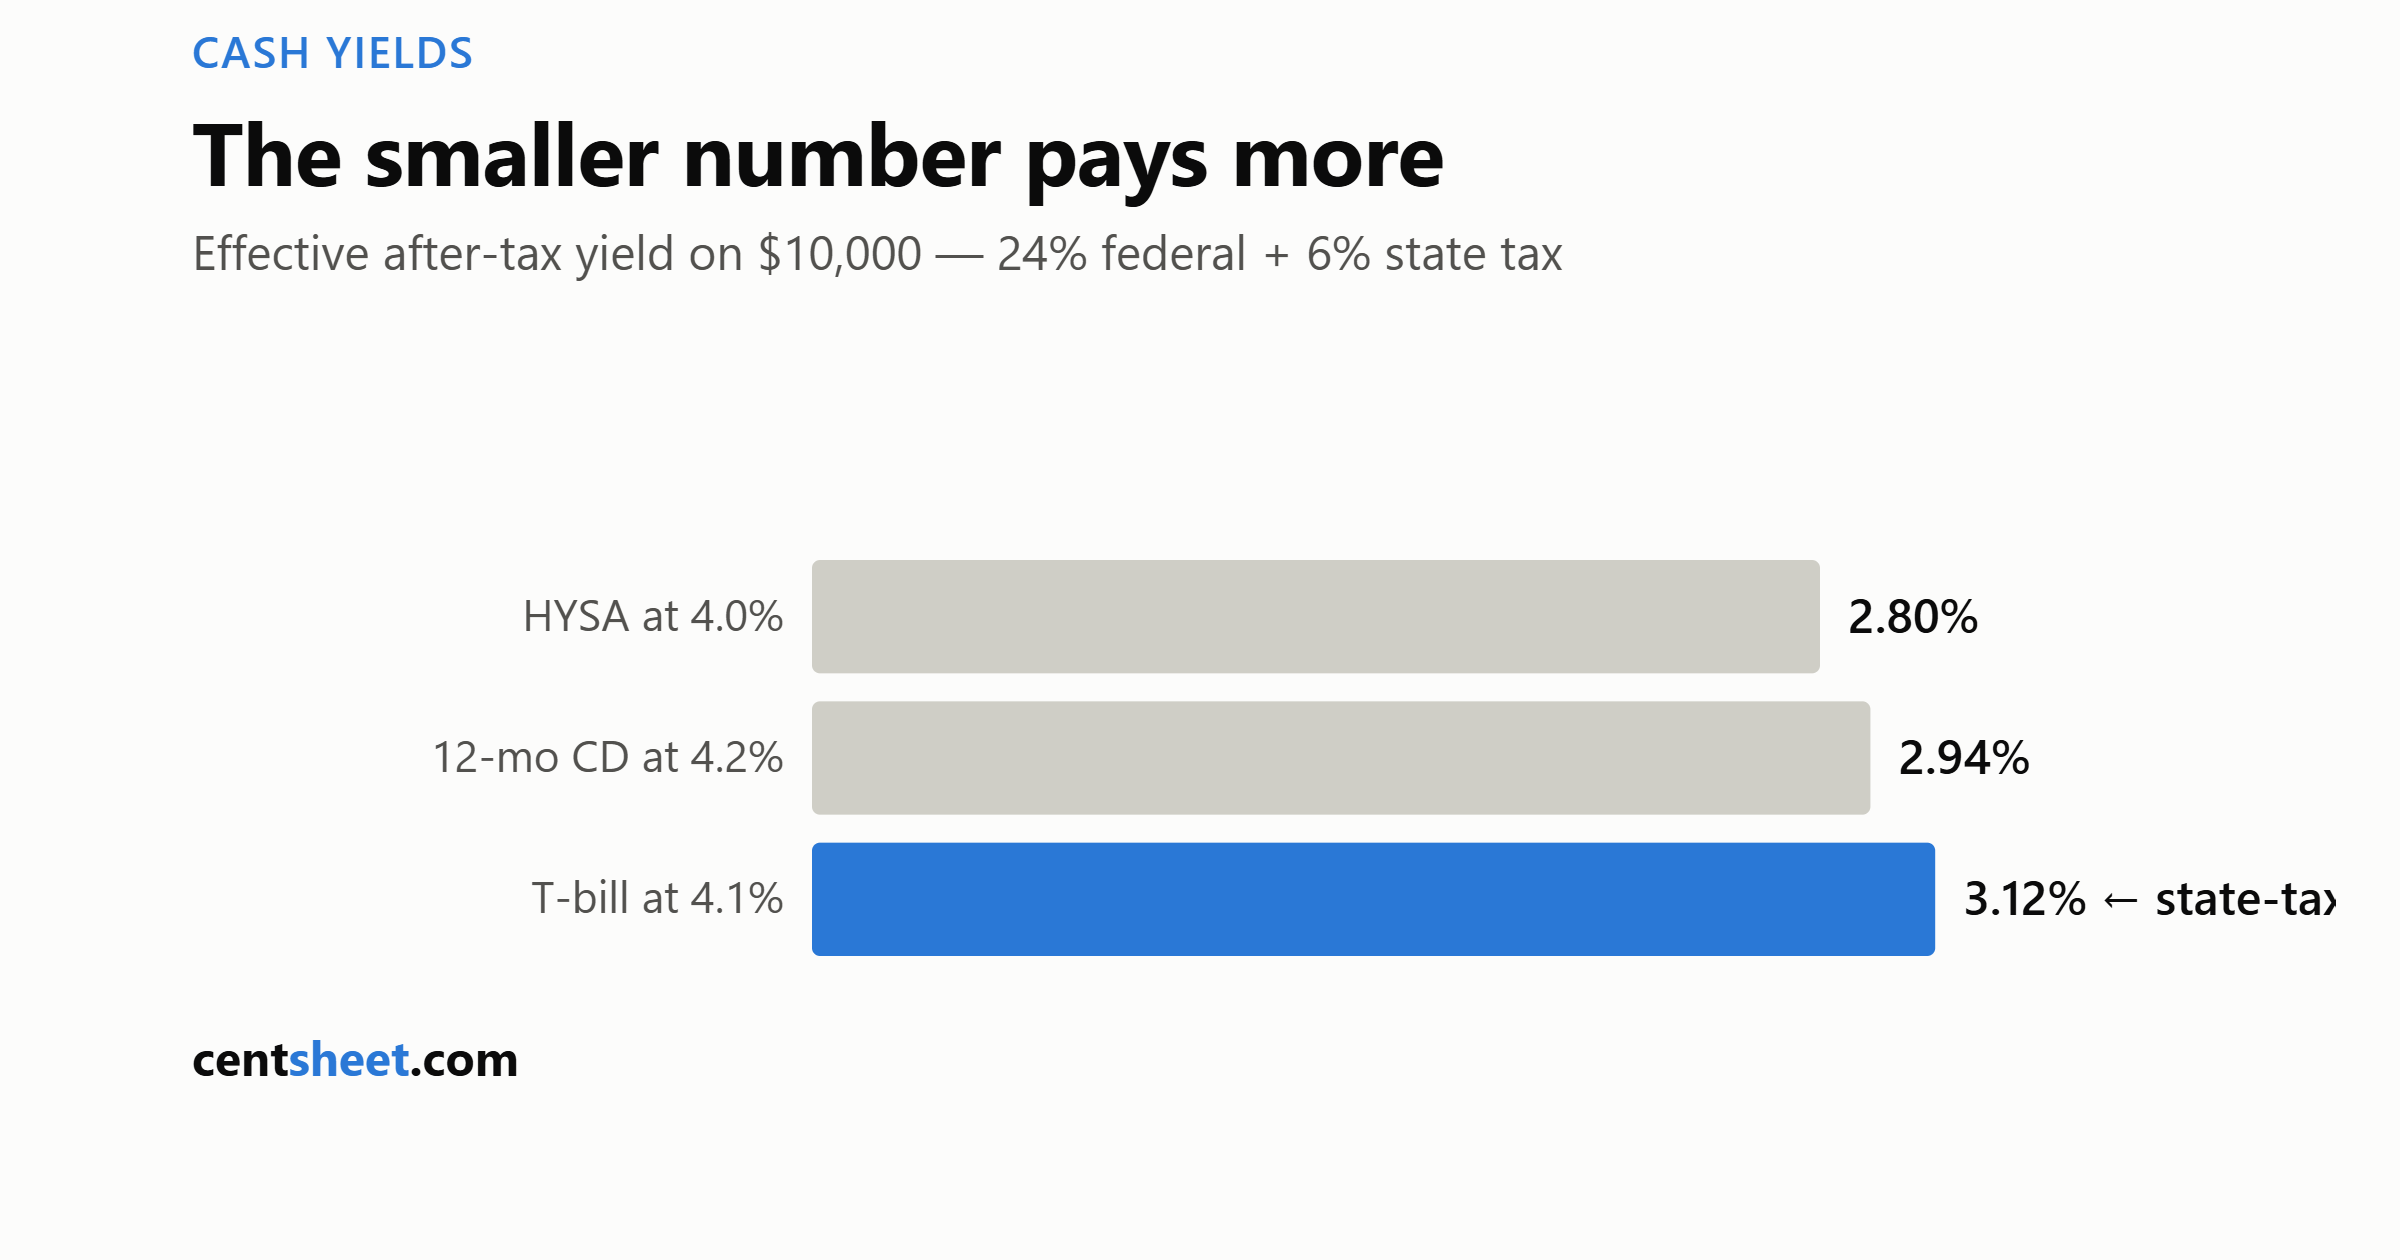
    $10,000 for a year. Illustrative rates deliberately set close together — HYSA 4.0%, 12-month CD 4.2%, T-bills 4.1% — and close to real market levels as of August 2026, when the 1-year Treasury sat near 4.0% and top HYSAs and CDs paid about the same. Saver pays 24% federal and lives in a 6% income-tax state.

    Headline Gross interest Taxed at After-tax Effective rate
    HYSA 4.0% $400 30% (fed+state) $280 2.80%
    CD 4.2% $420 30% (fed+state) $294 2.94%
    T-bill 4.1% $410 24% (fed only) $311.60 3.12%

    The T-bill wins with the middle headline rate. The state exemption is worth roughly the state tax rate times the yield — invisible on every comparison chart, real on every tax return.

    Three qualifiers, honestly stated: in a no-income-tax state the exemption is worth nothing and the CD wins this table. In a high-tax state the T-bill’s edge grows well beyond this example. And at small balances the absolute dollars are modest — on $10,000 the T-bill beats the CD by about $18/year here; on $100,000 it’s $180.

    The early-exit asymmetry

    The tax angle is the underrated difference; the exit terms are the misunderstood one.

    Breaking a CD costs you interest. A common structure for a 1-year CD is a penalty of roughly three months of interest, though terms vary meaningfully by bank — read yours before you buy. On our 4.2% CD, exiting at month five means roughly $175 earned minus a $105 penalty: net $70, an effective annualized 1.68% — worse than any savings account you’d have used instead.

    T-bills have no penalty — but they have a market. Sell before maturity and you get the market price, which can be slightly more or less than you paid if rates moved. For 4–26 week bills the swing is small, but it is not zero, and nobody refunds you a “penalty” because there wasn’t one — you simply got the price.

    The HYSA’s exit cost is zero. That’s its entire argument, and for money that might be needed on a Tuesday, it’s decisive.

    When each one actually fits

    Money Vehicle Why
    Emergency fund HYSA Exit cost zero; the fund’s job is availability, not yield
    Known expense, known date (tuition in 9 months) CD or T-bill matched to the date Lock the rate; no exit needed if the date is real
    Known expense, income-tax state T-bill ladder The exemption stacks with the rate lock
    “Parking” cash while deciding HYSA or 4-week T-bills Flexibility dominates
    Rate expected to fall CD or longer T-bill Fixed beats floating on the way down; HYSA rates follow the market down quickly

    A note on ladders, since the word gets used as magic: buying T-bills or CDs in staggered maturities (every 4–13 weeks) is just a way to get most of the fixed-rate benefit while never being more than a few weeks from cash. It’s a fine technique and a boring one, which is a compliment.

    Bottom line

    The ranking that matters is after-tax, after-exit-terms, for your state and your date certainty — not the headline table. The one-minute version: emergency money goes in the HYSA regardless; dated money goes fixed; and if your state taxes income, run the T-bill exemption math before defaulting to the shiniest CD rate, because a smaller number sometimes pays more.


    CentSheet publishes educational content, not personalized financial advice. Rates shown are illustrative, not current quotes; tax treatment described is general and not tax advice for your situation.
  • Credit Utilization: The Score Factor You Can Fix in 30 Days

    Credit Utilization: The Score Factor You Can Fix in 30 Days

    Most credit-score factors reward patience: age of accounts, payment history, time. Utilization is the exception — it’s a large slice of your score, it has essentially no memory, and it updates as fast as your card reports. Fix it this month and the score reflects it next month.

    That combination makes it the highest-leverage move available to most people with credit cards. It’s also widely misunderstood in two specific ways.

    What utilization actually is

    Utilization is your reported card balances divided by your credit limits — the share of available revolving credit you appear to be using. Scoring models treat high utilization as a distress signal, and the commonly cited guidance — the same figure FICO’s own consumer materials use — is to stay under roughly 30%, with lower being better.

    Say you have three cards totaling $15,000 in limits and $4,600 in reported balances:

    Limit Reported balance Utilization
    Card A $3,000 $2,800 93.3%
    Card B $7,000 $1,200 17.1%
    Card C $5,000 $600 12.0%
    Overall $15,000 $4,600 30.7%

    Misunderstanding #1: it’s measured per card too

    The overall 30.7% above looks borderline-fine. Card A at 93.3% is the problem — scoring models look at individual cards as well as the total — FICO’s public documentation describes considering “how much of each credit line is being used” — so one maxed card hurts even when the overall number is acceptable.

    Practical consequence: where your balance sits matters. $4,600 spread evenly across those three cards produces the same 30.7% overall with no card above 35% — a materially better picture from identical debt.

    Misunderstanding #2: it’s not about the due date

    This is the one that costs people. Utilization is calculated from the balance your issuer reports to the bureaus, which is typically the balance on your statement closing date — not what’s left after you pay the bill by the due date.

    You can pay in full every month, never pay a cent of interest, and still report high utilization — because the statement closes before your payment.

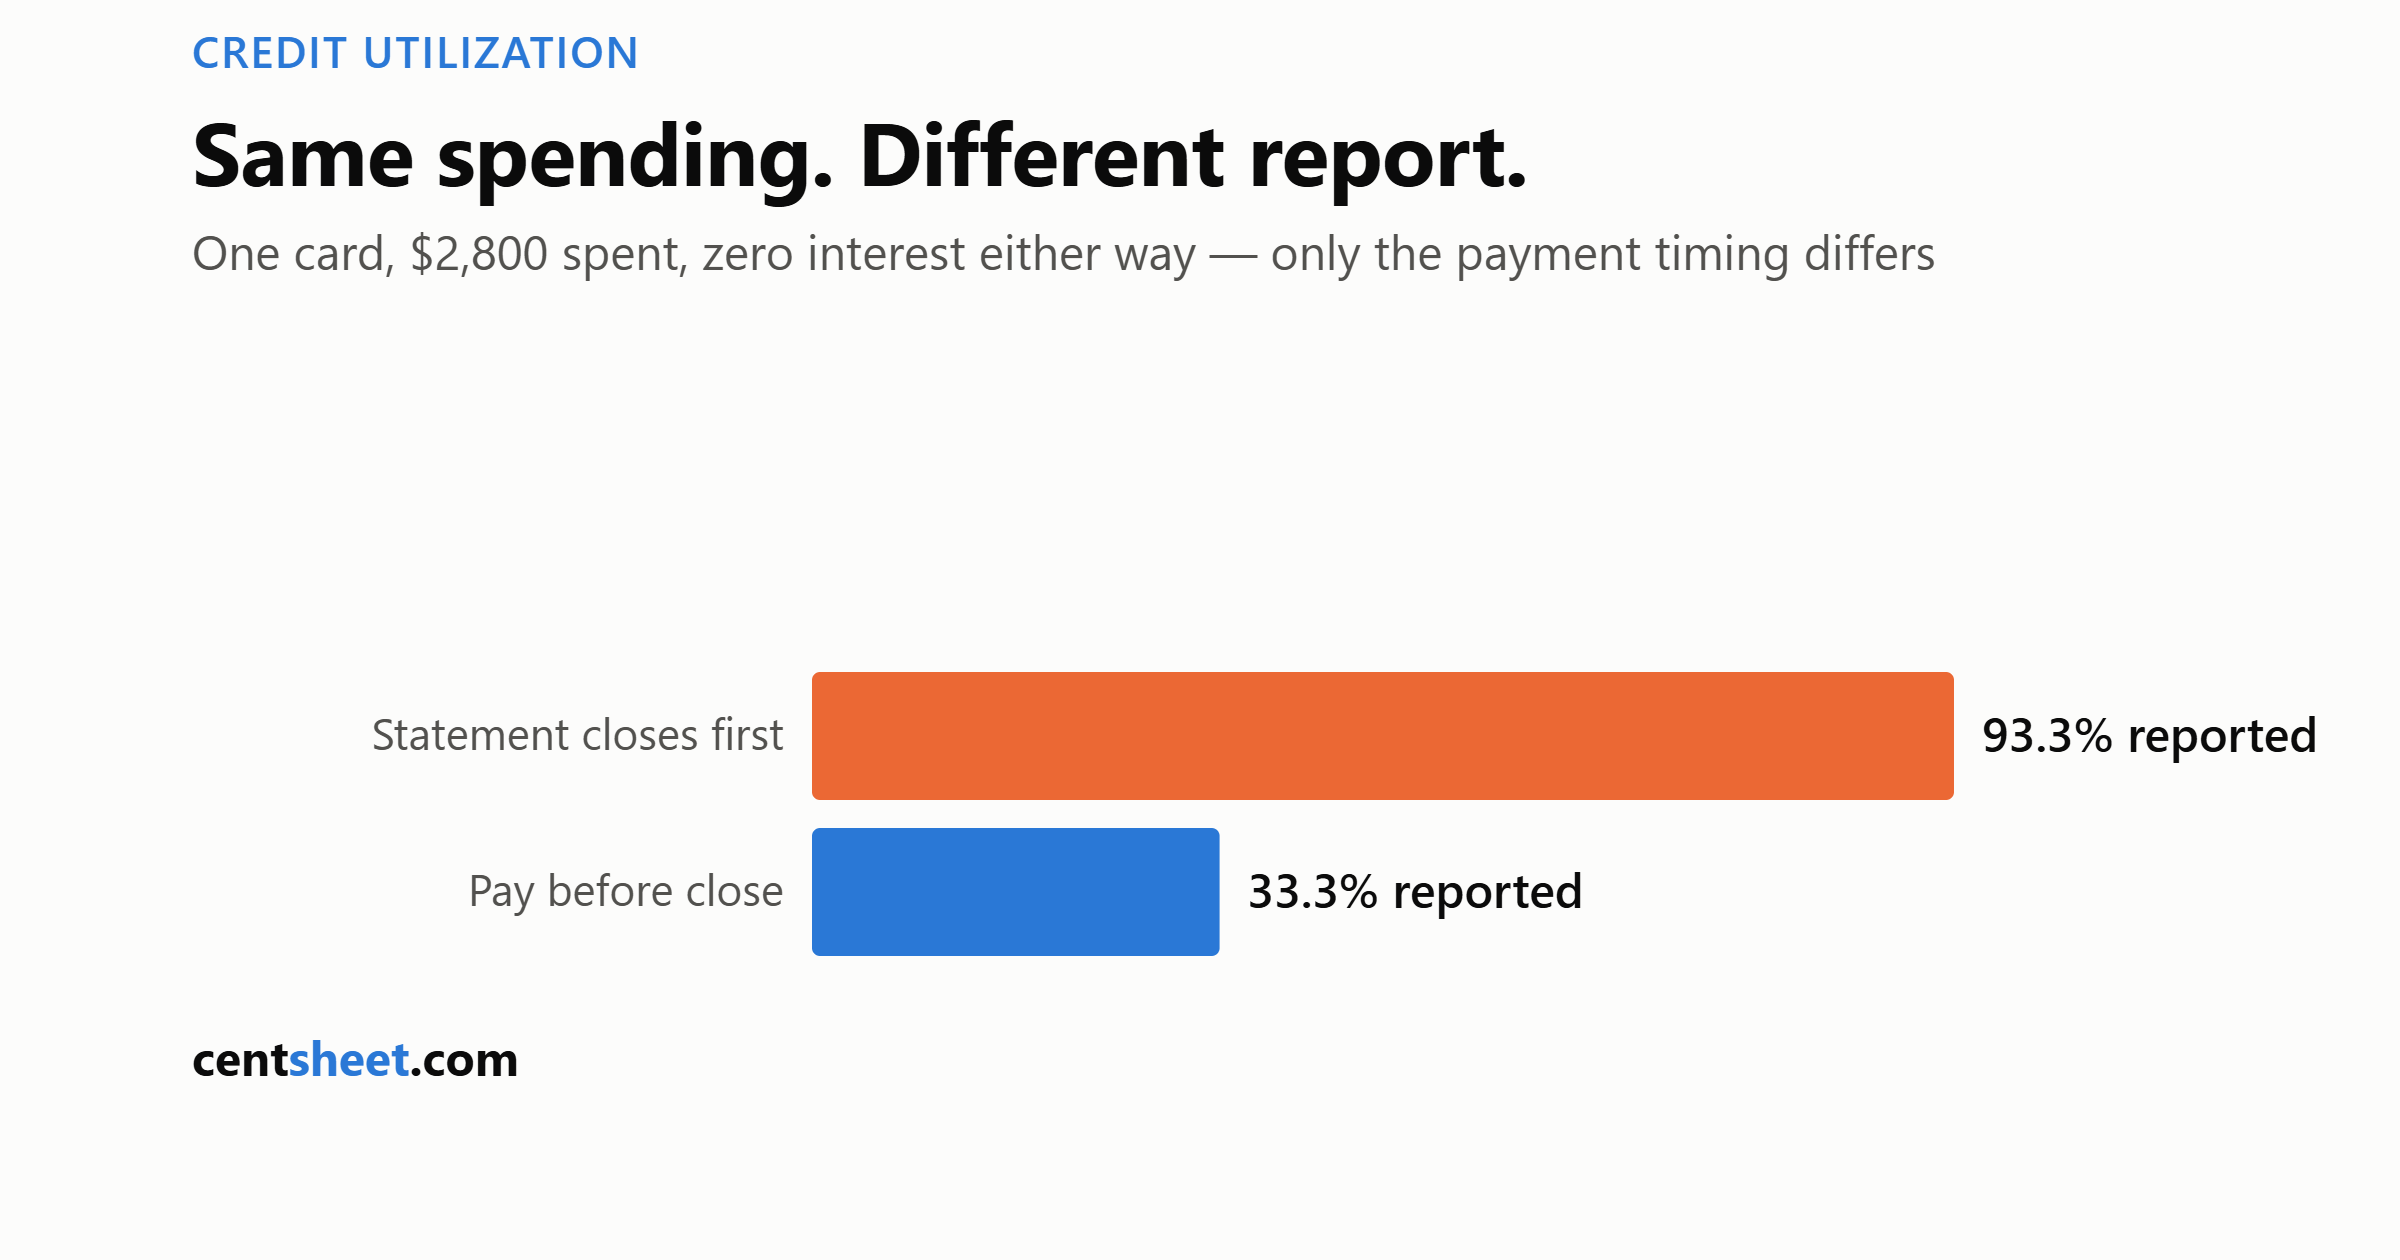
    The fix is timing, and it’s free: pay down the card before the statement closes, then pay whatever remains by the due date as usual. On Card A above, paying $1,800 a few days before the close date drops the reported balance to $1,000 — utilization reported at 33.3% instead of 93.3%. Same spending, same zero interest, very different report.

    The 30-day playbook

    1. Find each card’s statement closing date (on the statement or in the app — it is not the due date). 2. Target the worst card first. One card above 90% is doing more damage than three cards at 25%. 3. Pay before the close, not just before the due date. 4. Don’t close old cards to “clean up.” Closing a card deletes its limit from your denominator and pushes utilization up on everything else — a classic own-goal. 5. A limit increase cuts utilization arithmetically — same balance over a bigger denominator — but only helps if the extra headroom doesn’t become extra spending. Know yourself before requesting one.

    What this is not

    Utilization tuning is presentation, not progress — it changes how existing debt reports, not what you owe. If the balance itself is the problem, the real fix is the payoff math, and a balance carried at 24% APR costs vastly more than any score benefit is worth. Optimize the reporting while paying it down, not instead of paying it down.

    One more honesty note: scoring models are proprietary and change over versions. The mechanics above reflect the publicly documented behavior of the major models; nobody outside those companies knows exact weightings, and anyone quoting you precise point impacts is guessing.


    CentSheet publishes educational content, not personalized financial advice.
  • Zero-Based Budgeting, Honestly Reviewed: Powerful, Tedious, and Worth It for Some

    Zero-Based Budgeting, Honestly Reviewed: Powerful, Tedious, and Worth It for Some

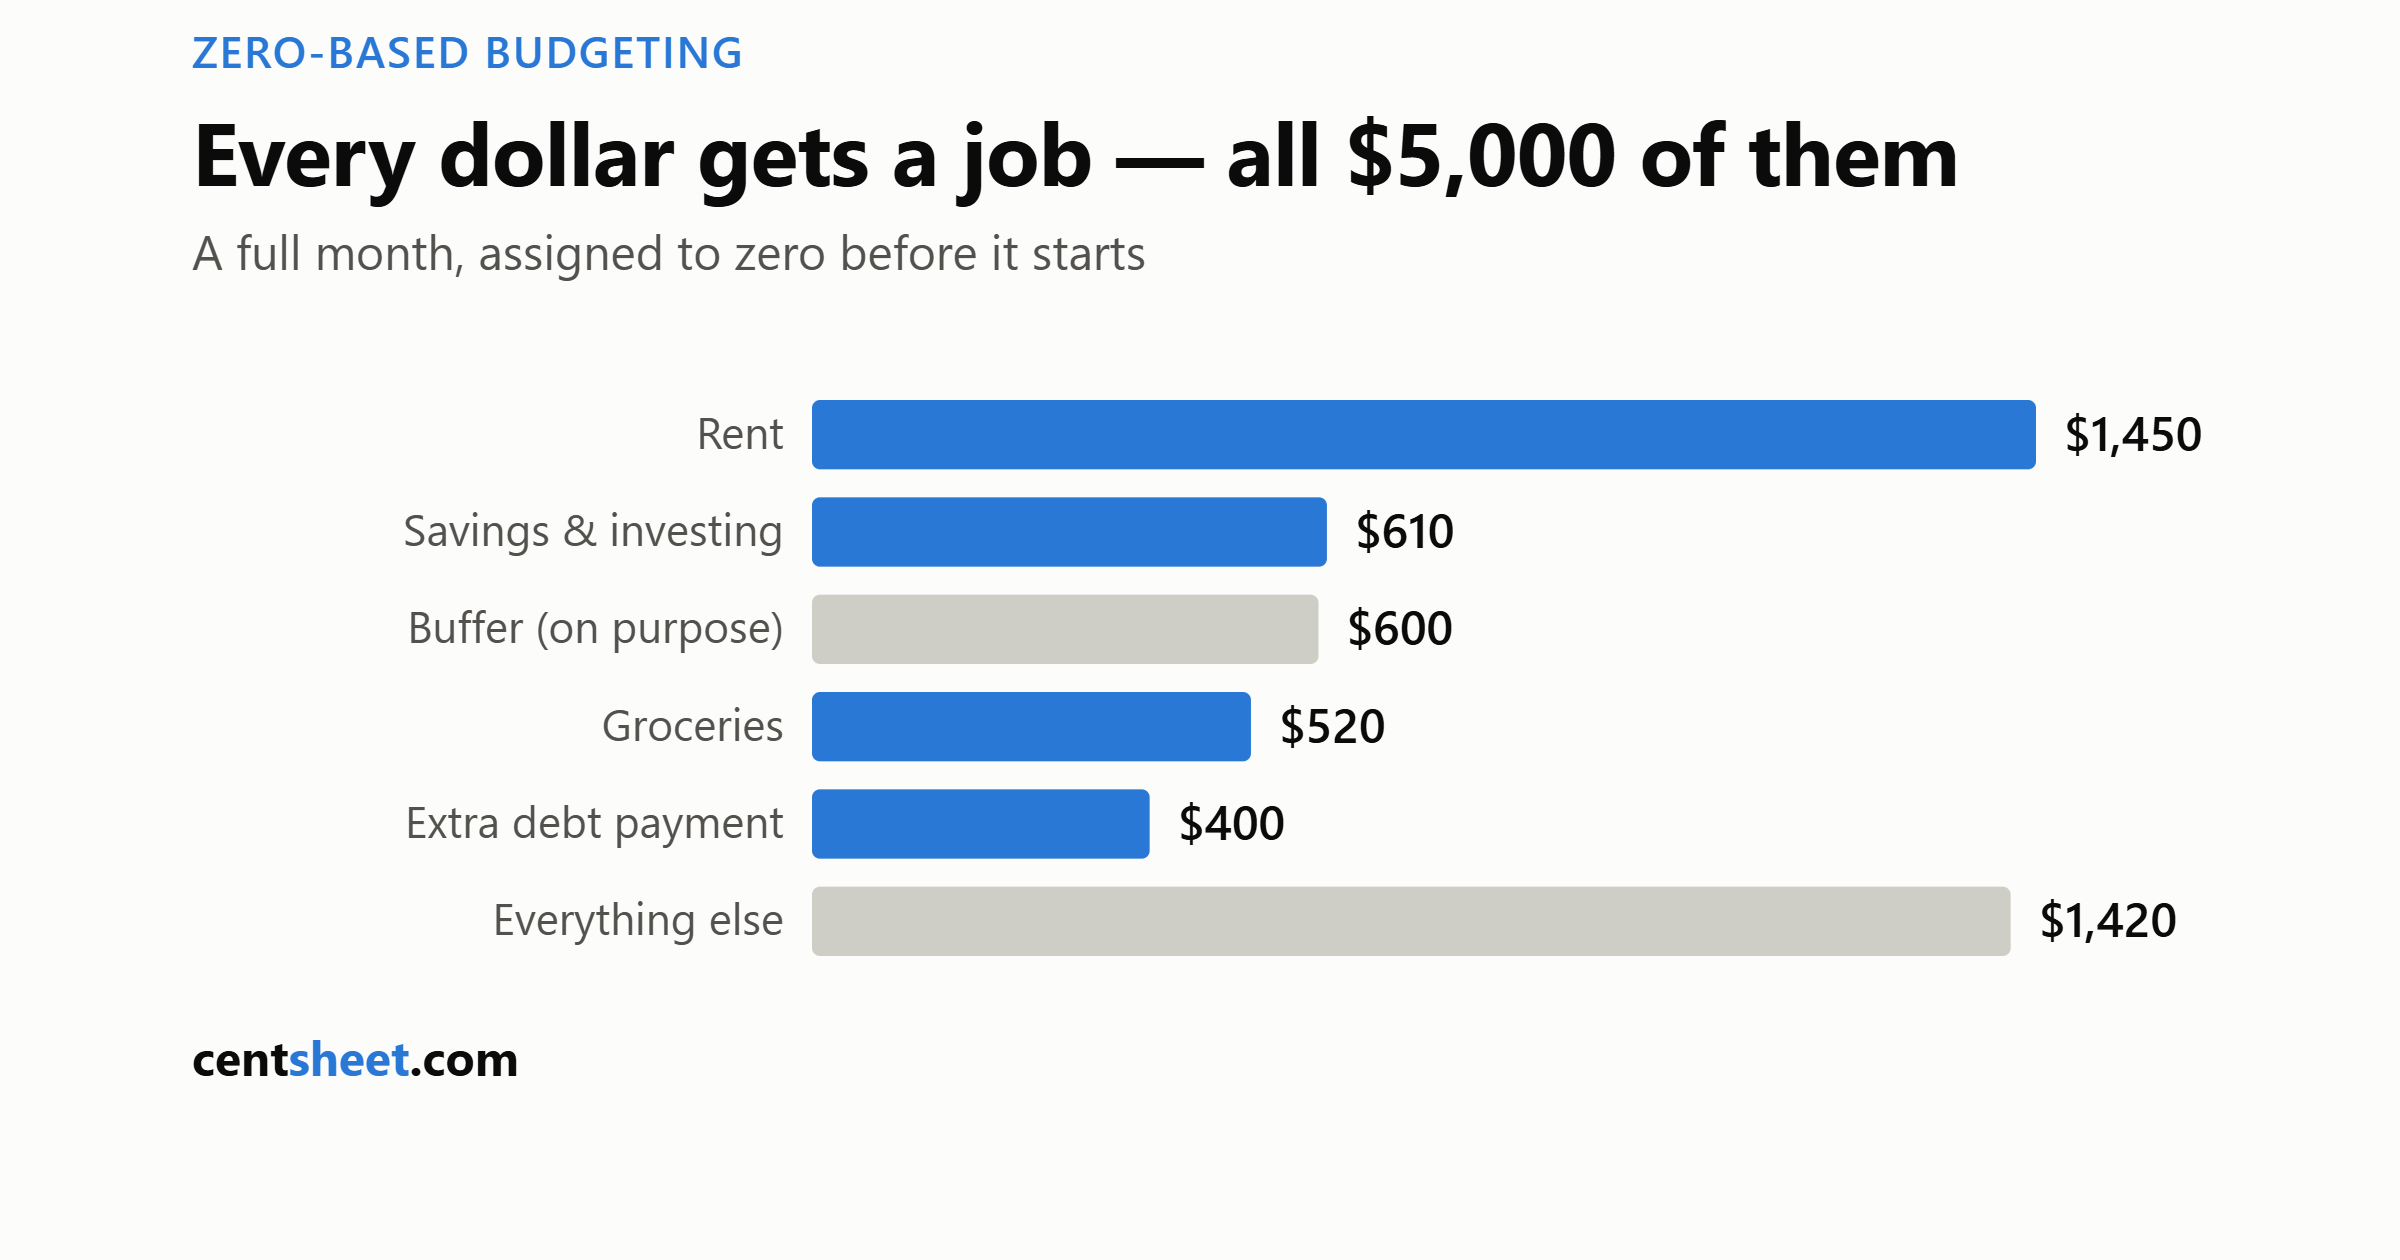
    Zero-based budgeting has one rule: income minus everything equals zero. Before the month starts, every dollar you expect to receive gets assigned a job — rent, groceries, debt, savings, fun — until nothing is left unassigned. Not spent. Assigned.

    It is the most effective budgeting method we know of. It is also the one people quit fastest. Both facts matter, and most articles only tell you one of them.

    The idea in one table

    Take-home pay of $5,000/month, fully allocated before day one:

    Job Assigned
    Rent $1,450
    Utilities & internet $320
    Groceries $520
    Transport $260
    Insurance $180
    Subscriptions $140
    Debt payments beyond minimums $400
    Sinking funds (car, holidays, repairs) $300
    Savings & investing $610
    Dining & fun $220
    Buffer / unassigned-on-purpose $600
    Total $5,000

    The last line is the whole method. When the total must hit exactly $5,000, every additional dollar to one category is visibly a dollar taken from another. Trade-offs stop being abstract — that’s the mechanism that makes this work where percentage rules stay vague.

    Why it works when it works

    It converts “can I afford this?” into a factual question. Under zero-based budgeting the answer is whatever the category says. If Dining shows $40 left, the question isn’t philosophical.

    It finds leaks percentage budgets can’t see. A 50/30/20 budget can be “on target” while $200/month dribbles away across a dozen small wants. Zero-based forces each dribble to have a name.

    It handles irregular expenses natively. The sinking-funds row isn’t an add-on; assigning ahead is the entire worldview.

    The buffer line is legal. Assigning $600 to “unassigned, on purpose” is a valid job. Beginners skip this and then treat the first surprise as proof the method failed. The buffer is a category.

    Why people quit

    Honesty section. Zero-based budgeting fails in practice for three predictable reasons:

    The maintenance cost is real. This is not a set-and-forget system. Transactions need categorizing and categories need adjusting — call it 15–30 minutes a week once you’re fluent, more at first. That’s cheap for what it buys, but it is not zero, and pretending otherwise is how people end up feeling like failures in week three.

    Perfectionism kills it. The month never goes to plan. Zero-based budgeting’s actual skill is reassigning mid-month — moving $60 from Dining to cover the pharmacy trip — without treating it as defeat. People who need the plan to survive contact with reality quit by month two.

    Couples need buy-in, not compliance. One partner running a zero-based budget the other merely tolerates produces resentment with a spreadsheet attached.

    Who should actually use it

    Strong fit: variable or tight income where every dollar’s job matters; anyone escaping paycheck-to-paycheck; anyone whose 50/30/20 diagnostic showed a wants-leak they can’t locate; detail-tolerant people who like closed systems.

    Poor fit: high savings rate already on autopilot and no leaks — a simple automated split beats the overhead. Honestly: if you save 30%+ automatically and bills are handled, zero-based budgeting buys you little beyond precision you don’t need.

    The middle path most people land on: zero-based for two or three months as a diagnostic deep-clean, then relax back to an automated system with the insights kept. That’s not quitting; that’s using the tool for what it’s best at.

    Tooling, briefly

    You don’t need software — a spreadsheet works, and the discipline matters more than the app. Purpose-built tools (the YNAB school of apps) automate the mechanics and sync couples; their cost is real money and their method opinions are strong. Start with a spreadsheet for one month before paying anyone. If the habit sticks on paper, an app makes it easier; no app makes it exist.

    Bottom line

    Zero-based budgeting is the power tool of personal budgeting: highest control, highest effort, genuinely transformative for the situations that need it, overkill for the ones that don’t. Run it for ninety days before you judge it — and if you keep only the sinking funds and the leak-findings, you still come out ahead.


    CentSheet publishes educational content, not personalized financial advice.
  • Sinking Funds: The Budgeting Tool That Kills “Surprise” Expenses

    Sinking Funds: The Budgeting Tool That Kills “Surprise” Expenses

    Most budget “surprises” aren’t surprises. Car insurance comes due every six months, on a date printed on the policy. December happens every year. Cars need tires on a schedule you can roughly predict. Yet these predictable irregulars are what blow up most budgets — and then get charged to a card, or worse, pulled from the emergency fund.

    The fix is old, unglamorous, and nearly foolproof: the sinking fund. You take every large irregular expense, divide it by the months until it arrives, and set that amount aside monthly. The lump sum stops being a spike and becomes a flat line item.

    The mechanic, with real numbers

    Irregular expense Timing Monthly set-aside
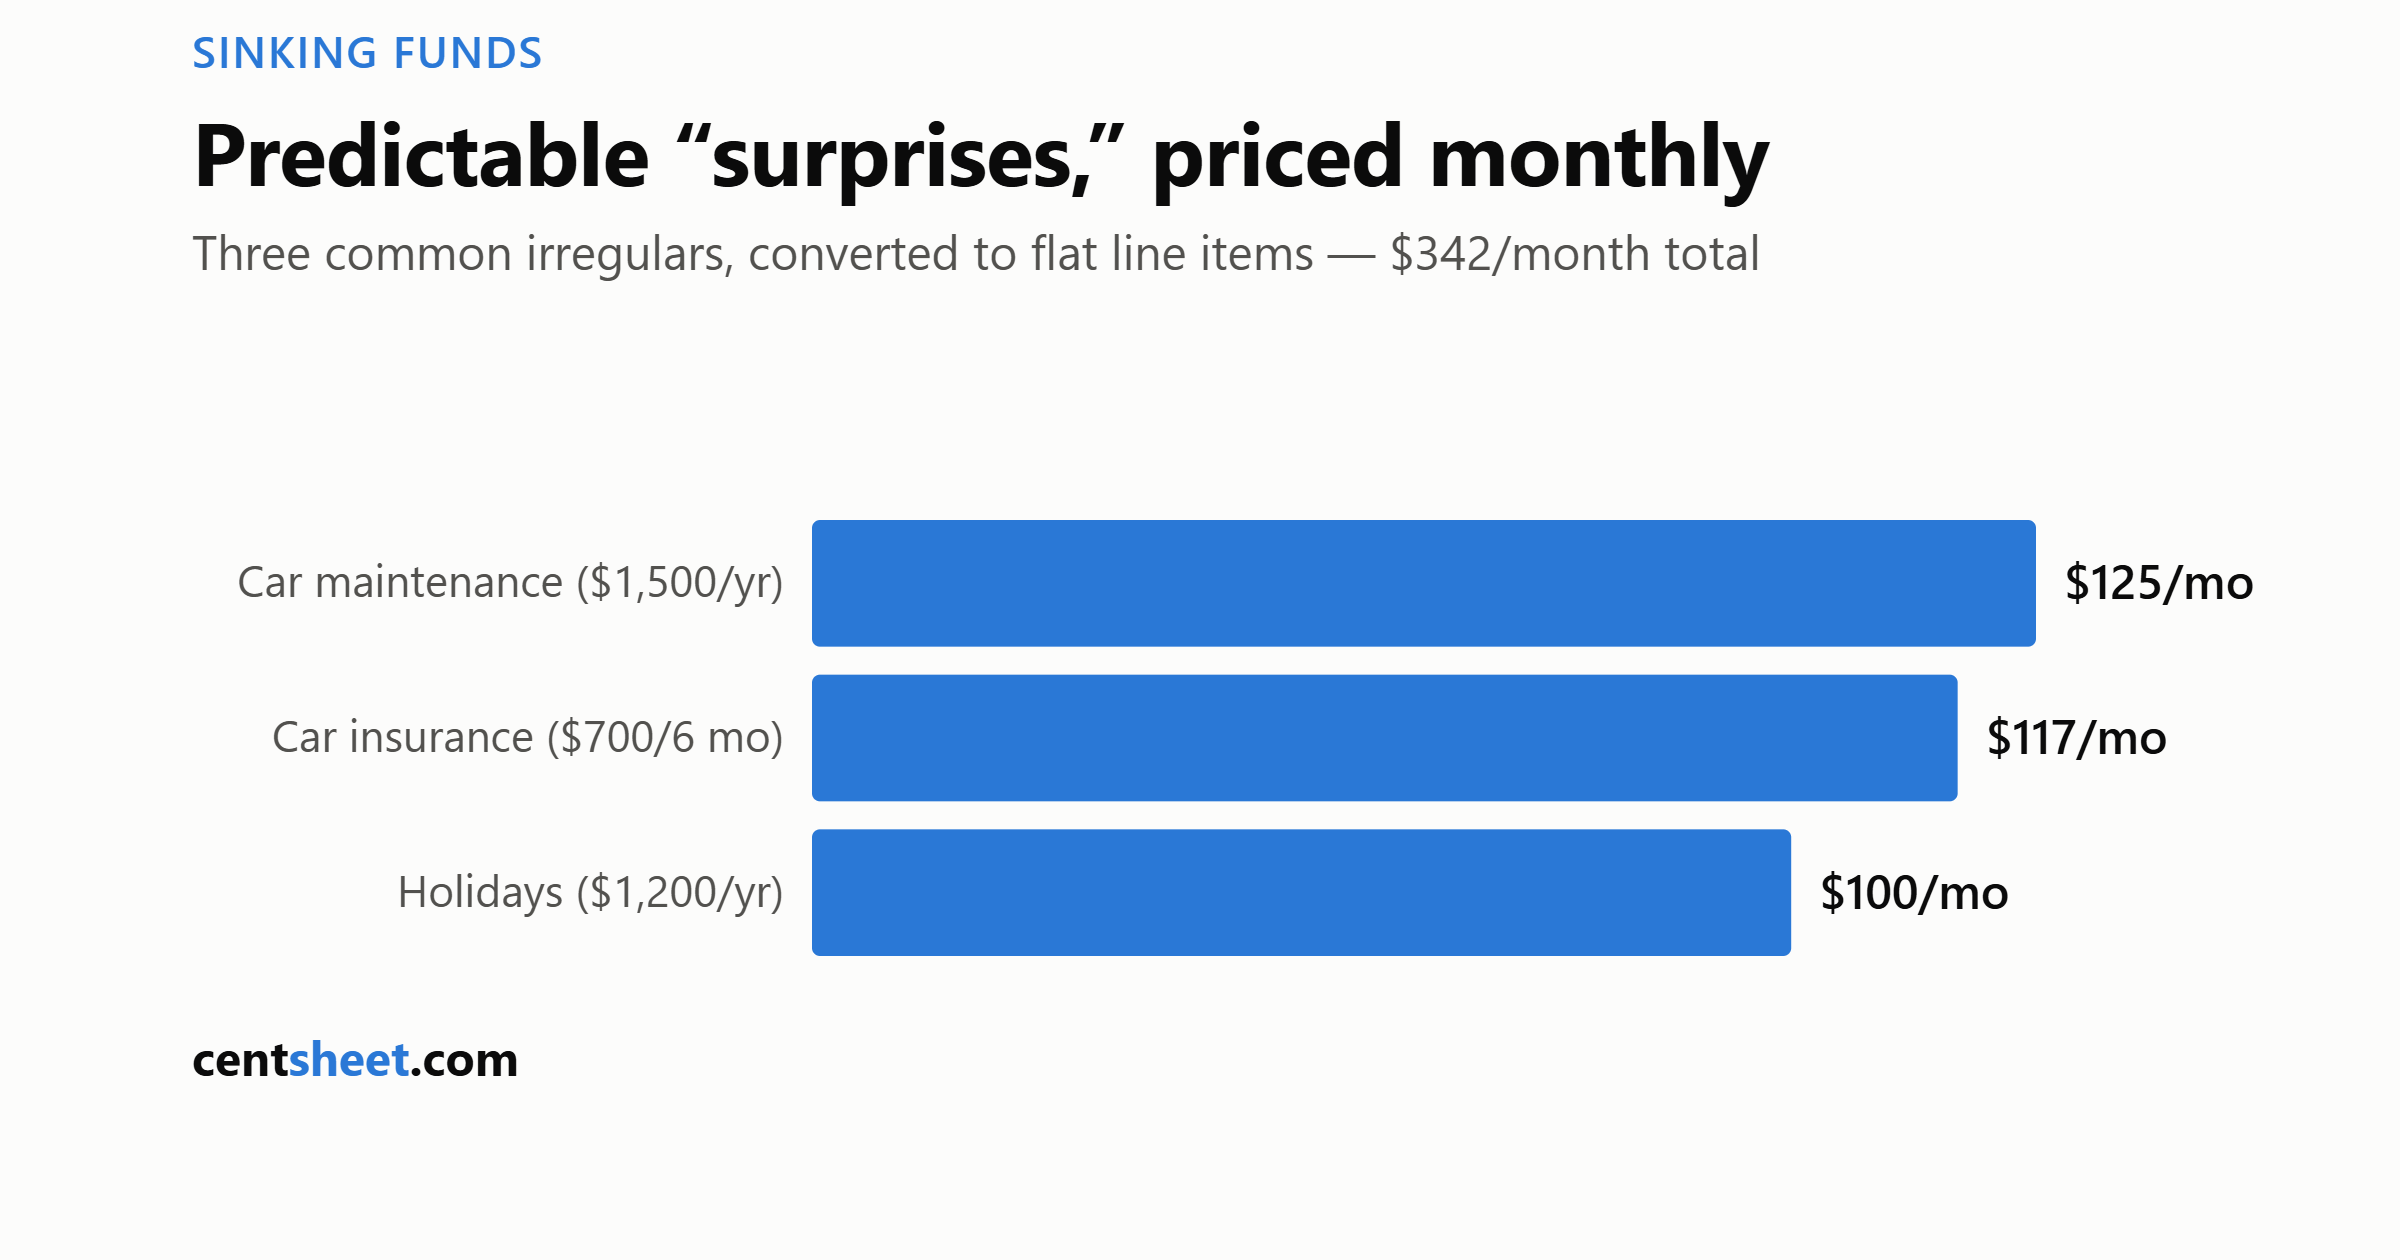
    $700 car insurance premium every 6 months $117
    $1,200 holiday season (gifts, travel, hosting) yearly $100
    $1,500 car maintenance & repairs yearly, lumpy $125

    Three funds, $342/month combined — and three of the most common budget-wreckers simply stop being events. When the insurance bill lands, the money is sitting there with the bill’s name on it. Nothing is borrowed, nothing is “found,” no month gets wrecked.

    That’s the entire trick. The rest is implementation detail — but the details decide whether it sticks.

    Sinking fund vs. emergency fund — the line that matters

    Both are cash set aside, which is why people blur them. The distinction:

    • Emergency fund: for events you can’t schedule — job loss, medical, the transmission. Unknown timing, unknown size. (Sizing it is its own question.)
    • Sinking funds: for events you can schedule — premiums, holidays, annual subscriptions, the next set of tires. Known-ish timing, estimable size.

    The blur is expensive in one specific way: every predictable expense you don’t sink eventually presents itself as an “emergency,” drains the emergency fund, and trains you to think emergencies happen monthly. They don’t. Decembers do.

    How to find yours in fifteen minutes

    Scroll twelve months of bank and card statements and write down every expense that was over ~$200 and not monthly. Common catches:

    • Insurance premiums (auto, home, life) paid semi-annually or annually — often with a discount vs. monthly billing that sinking makes claimable
    • Holidays and birthdays — the calendar’s most predictable “surprise”
    • Car registration, maintenance, tires
    • Annual subscriptions and memberships
    • Back-to-school, travel to family, pet vet visits
    • Home maintenance, if you own — the roof is not an emergency; it’s a slow bill

    Divide each by months-until-due. Sum them. That number — often $250–500/month for a typical household — is how much your “normal” months were quietly borrowing from your “disaster” months.

    Implementation: fewer buckets than you think

    The failure mode of sinking funds is administrative sprawl — seventeen named accounts, abandoned by March. What works:

    One separate savings account, one spreadsheet row per fund. A single high-yield savings account holds all sinking money; a simple tracker (or your bank’s built-in “buckets,” which several online banks offer) splits it on paper. Transfers automate on payday. The account earns interest while it waits, which monthly-billed premiums never do.

    Start with the worst three offenders, not all twelve. The point is the habit; coverage can grow.

    When the bill arrives, pay it from the fund and restart the clock. No ceremony.

    The quiet payoff

    A budget with sinking funds behaves differently in a way that compounds: months become boring. Boring months are what make any budget ratio you follow actually hold, because the ratios stop being demolished quarterly by a bill you technically knew about. Budgets rarely fail from small leaks; they fail from scheduled explosions treated as acts of God.

    $342 a month, in this example, buys the end of that.


    CentSheet publishes educational content, not personalized financial advice.
  • The 50/30/20 Budget, Stress-Tested at Four Incomes (It Breaks at Two of Them)

    The 50/30/20 Budget, Stress-Tested at Four Incomes (It Breaks at Two of Them)

    The 50/30/20 rule — 50% of take-home pay to needs, 30% to wants, 20% to savings — is the most-repeated budgeting advice in America, popularized by Senator Elizabeth Warren back when she was a bankruptcy law professor. It’s popular because it’s simple.

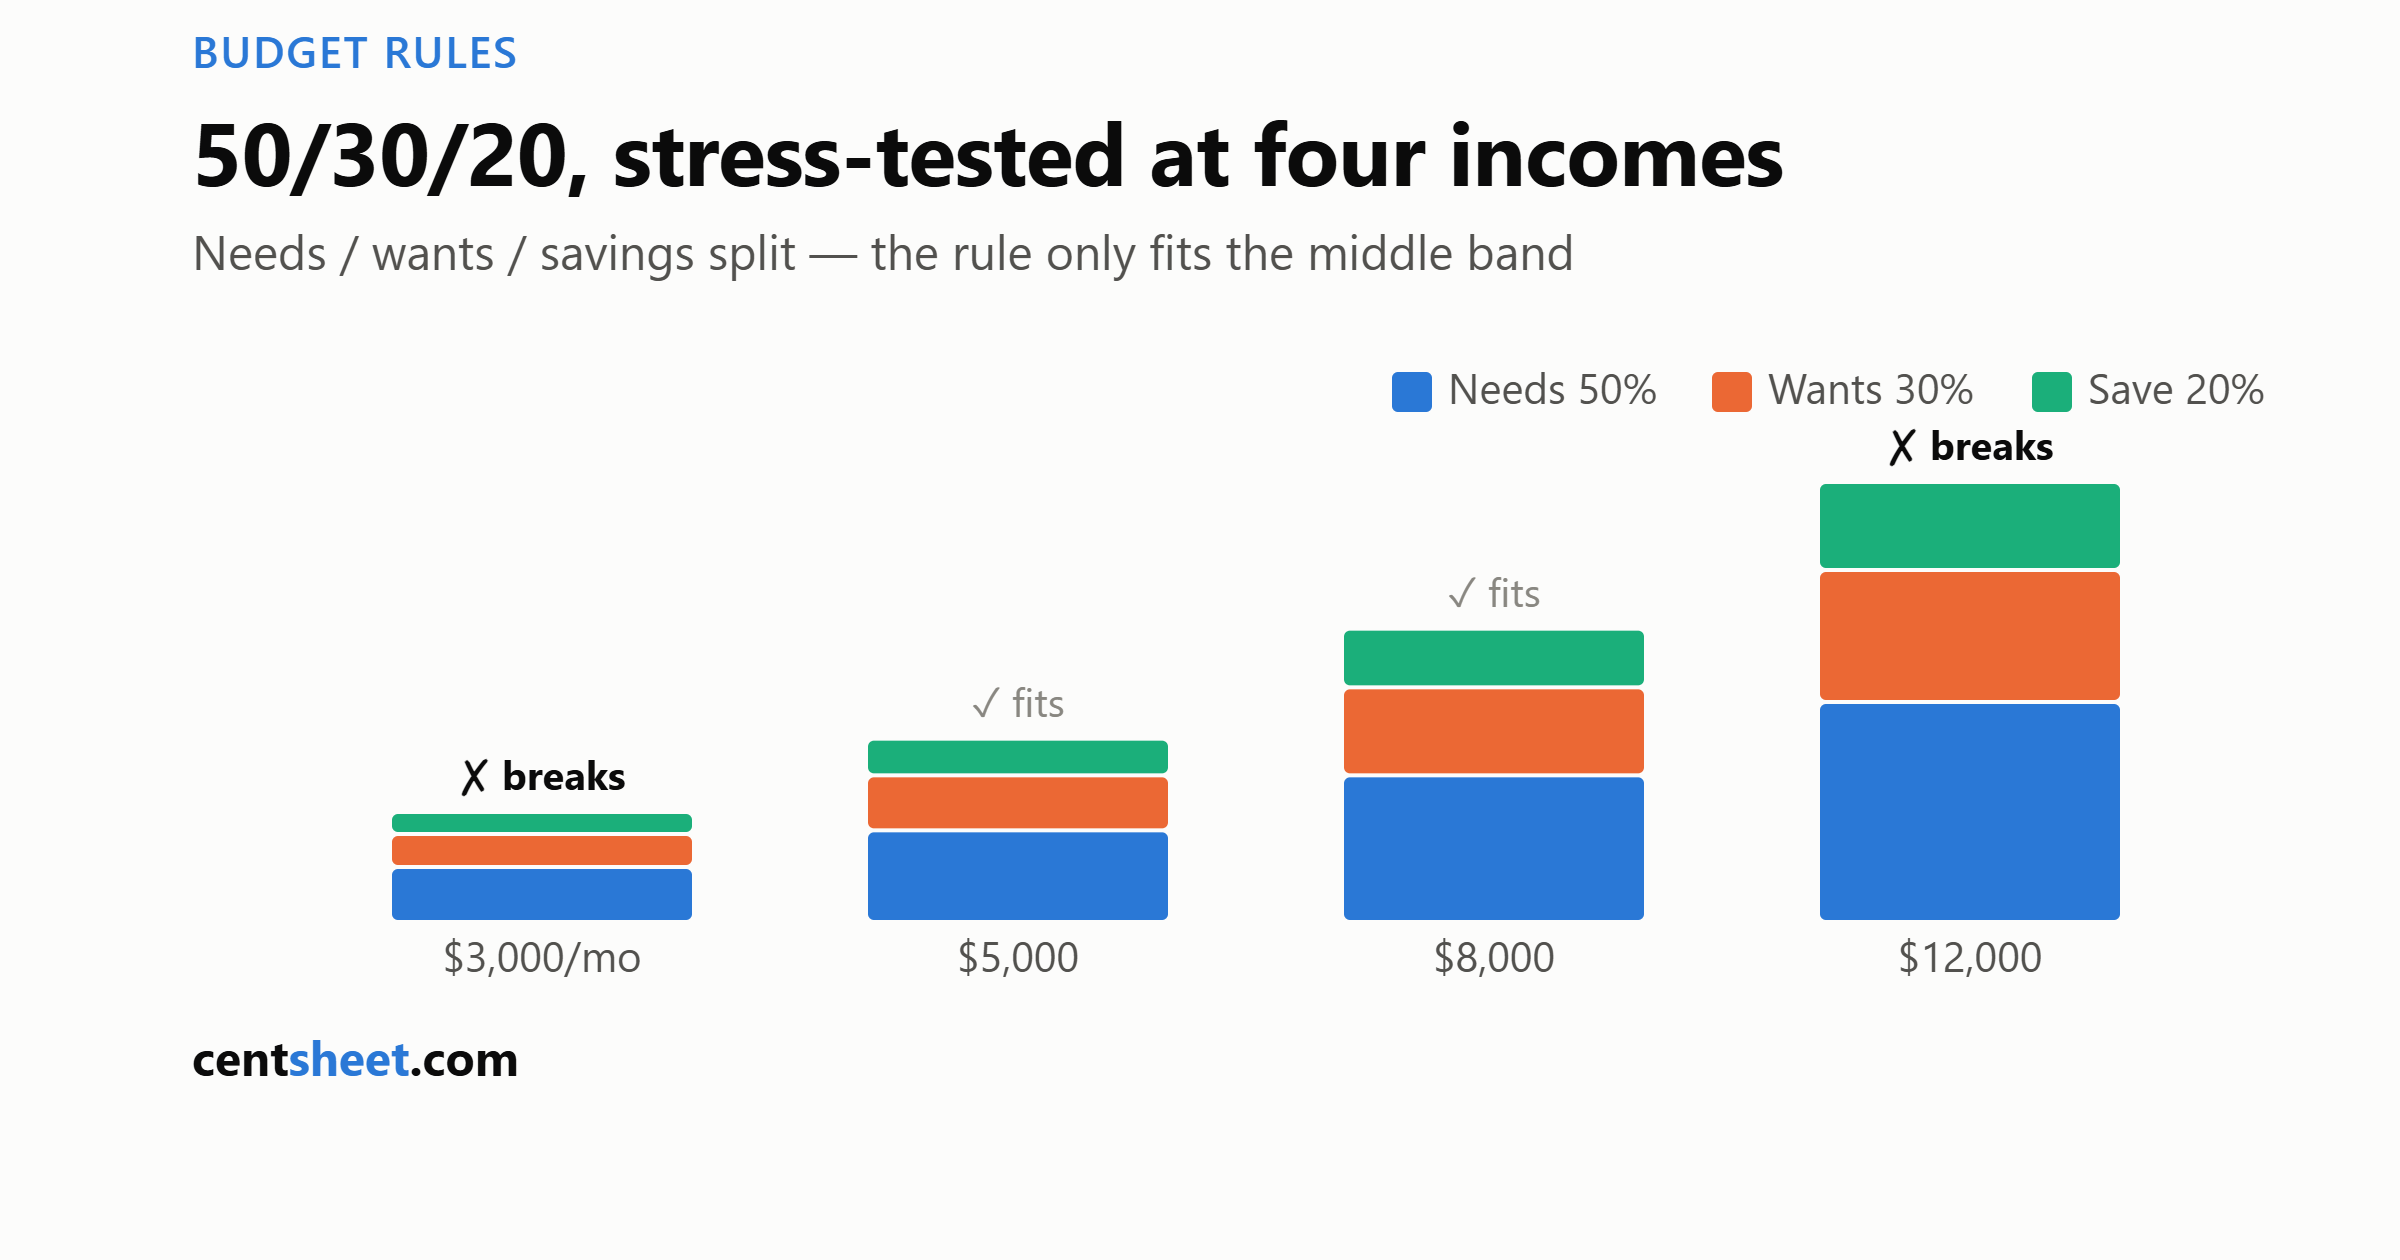
    It’s also treated as universal, and it isn’t. Run it at four different incomes and watch what happens.

    The rule at four take-home levels

    Monthly take-home Needs (50%) Wants (30%) Savings (20%)
    $3,000 $1,500 $900 $600
    $5,000 $2,500 $1,500 $1,000
    $8,000 $4,000 $2,400 $1,600
    $12,000 $6,000 $3,600 $2,400

    Two of these rows work. Two are quietly broken.

    Where it breaks: $3,000/month

    At $3,000 take-home, the rule allots $1,500 for all needs — rent, utilities, groceries, insurance, transport, minimum debt payments. In much of the US, rent alone consumes most or all of it: the national median rent runs about $1,400, and the median asking rent on available listings tops $1,650 (Apartment List and Realtor.com data, mid-2026).

    Someone in this position running the numbers doesn’t have a discipline problem; they have arithmetic that doesn’t close. Telling them to “just follow 50/30/20” produces either shame or a quiet decision that budgeting is nonsense. Neither helps.

    What actually works at this level: flip the rule from prescription to diagnosis. If needs consume 65–75% of take-home, the leverage is structural — housing cost (roommate, relocation, renegotiation), transport cost, or income (the harder, more honest half of every budget conversation). Percentage-shuffling within the remaining 25% moves tens of dollars; the structural moves shift hundreds.

    Where it also breaks: $12,000/month

    The opposite failure is politer but real. At $12,000 take-home, the rule blesses $3,600/month of wants and asks for only $2,400 of savings — a 20% rate at an income where 35–45% is comfortably achievable without austerity.

    High earners who anchor on 50/30/20 are letting a rule designed as a floor for savings act as a ceiling. Lifestyle inflation loves a percentage that scales with income. At this level the better frame is a fixed savings-first target (“we save $4,500, then spend the rest guilt-free”), not a spending allowance that grows with every raise.

    Where it genuinely fits

    The $4,500–$9,000 take-home band is where the ratios describe a livable reality for most US households: needs fit inside half, 20% builds wealth at a meaningful pace, and 30% of wants is enough room that the budget doesn’t feel like punishment — which is what makes people actually keep budgets.

    If that’s you, the rule is a good starting scaffold. Check your real split below.

    50/30/20 budget check

    Enter monthly take-home pay (after taxes) and what you actually spend.
    Needs = housing, utilities, groceries, insurance, minimum debt payments, transport.
    Wants = everything optional. Savings = savings, investments, and extra debt payments.

    The 50/30/20 rule is a diagnostic, not a law — see the article above for where
    it breaks down. Educational tool — not financial advice.

    The three honest uses of 50/30/20

    1. As a diagnostic. Your actual percentages tell you which of three different problems you have: a cost-structure problem (needs way over 50%), a leak problem (wants over 30% and savings under 20%), or no problem at all. The fixes are completely different, which is why the single rule can’t be the fix. 2. As a first budget. For someone who has never categorized a dollar, three buckets beat forty categories. Precision can come later; the habit comes first. (Once the habit exists, zero-based budgeting is the upgrade path.) 3. As a floor for savings. 20% is a fine minimum at middling incomes. It is not a target to stop at when income rises.

    What the categories actually mean (the part everyone argues about)

    The classification that trips everyone: minimum debt payments are needs — miss them and consequences follow. Extra debt payments are savings, not needs — they build net worth, same as investing (the payoff-order math is its own article). Gym memberships, streaming, and dining out are wants no matter how strongly it feels otherwise at 6 a.m. — the test is “what happens if I stop for a month,” not “how virtuous is it.”

    Bottom line

    50/30/20 is a good thermometer and a mediocre thermostat. Measure yourself against it — the calculator above takes a minute — then act on the specific imbalance it reveals, not on the slogan.


    CentSheet publishes educational content, not personalized financial advice.
  • Compound Interest Isn’t Magic. It’s Just Slow — Then It Isn’t

    Compound Interest Isn’t Magic. It’s Just Slow — Then It Isn’t

    Every compound interest article quotes Einstein (he almost certainly never said it) and shows a hockey-stick chart with no numbers on the axes. This one just shows the numbers.

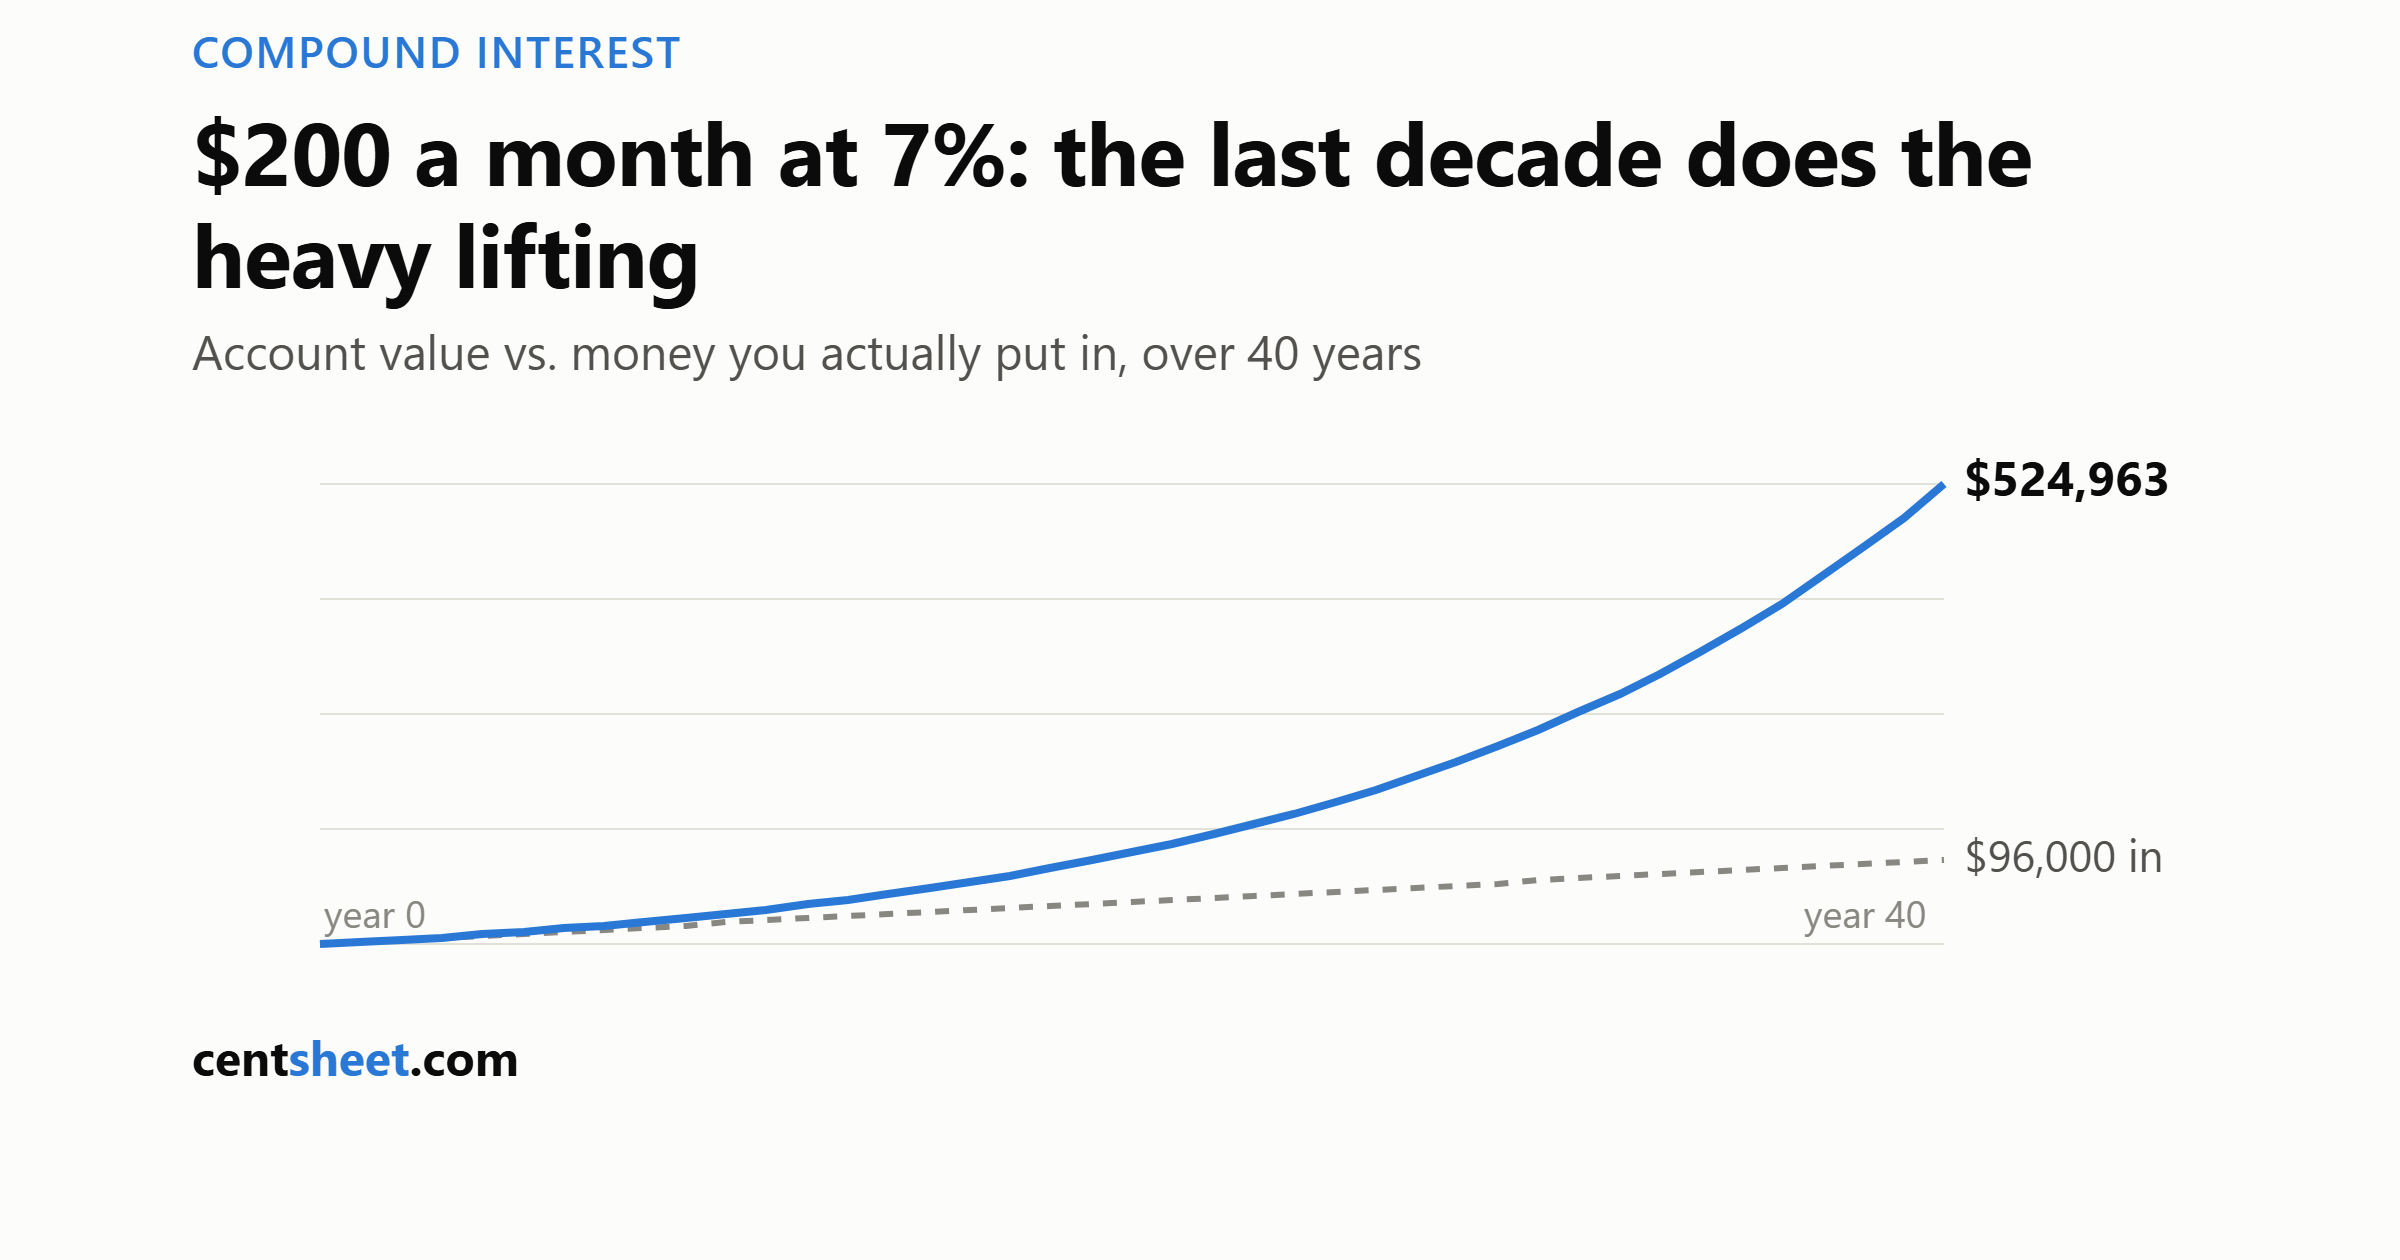
    The setup: you invest $200 every month and it grows at 7% a year, compounded monthly. Here’s what you have over time, next to what you actually put in:

    After You contributed It’s worth Growth
    10 years $24,000 $34,617 $10,617
    20 years $48,000 $104,185 $56,185
    30 years $72,000 $243,994 $171,994
    40 years $96,000 $524,963 $428,963

    Read the last column top to bottom. That’s the entire lesson of compounding in four numbers.

    The first decade is genuinely unimpressive

    After ten years of discipline you’ve turned $24,000 into $34,617. Solid — but nobody’s writing headlines about it. This is where most people conclude compounding is overrated and stop.

    The problem is that compounding’s payoff is loaded at the end. In decade one, growth added $10,617. Between years 30 and 40 — same $200/month, same 7% — it added $280,969. The last decade produces more growth than the first three combined, because by then the money doing the earning is mostly earnings.

    That’s not magic. It’s just exponential arithmetic meeting human impatience, and losing the early rounds.

    What waiting ten years actually costs

    Two people invest $200/month at 7% until age 65. One starts at 25, the other at 35.

    • Start at 25: $524,963
    • Start at 35: $243,994

    The ten-year head start cost $24,000 of extra contributions and produced $280,968 more money. The person who started earlier ends up with more than double, having contributed only a third more. There is no catch-up mechanism: the 35-year-old who wants the 25-year-old’s outcome needs to contribute roughly $430/month, not $200.

    If you take one action from this article, it’s this: the start date matters more than the amount. $50/month at 25 beats $0/month while waiting until you can “afford” $200.

    The rate matters — but you don’t control it

    Same $200/month for 30 years at different growth rates:

    Rate After 30 years
    5% $166,452
    7% $243,994
    10% $452,098

    A useful mental shortcut for these gaps is the Rule of 72: money doubles roughly every 72 ÷ rate years. At 7%, that’s about every 10.3 years — so a 40-year horizon holds roughly four doublings.

    You don’t get to choose your rate — markets deliver what they deliver. You choose the two inputs that are yours: the monthly amount and, above all, the number of years. Which is why fees deserve one sentence here: a fund charging 1% more than an equivalent one isn’t taking “1%,” it’s moving you down a full row in this table.

    About that 7%

    An honesty note most articles skip: 7% is a long-run, inflation-adjusted-ish assumption commonly used for broad US stock index returns, and it is an average, not a promise. Real decades have delivered far more and far less, in no predictable order. The table’s smooth curve never happens; the destination values over long horizons are what the assumption is for. Anyone showing you 12% projections is selling something.

    Compounding also runs in reverse gear beautifully: a credit card at 24% APR is the same table working against you at triple the rate. That’s why paying off high-interest debt is the best guaranteed “return” most households can buy.

    One lump sum, for comparison

    $10,000 invested once at 7% and left alone for 30 years: $81,165 — an eightfold multiple with zero further effort. Windfalls (bonus, tax refund, inheritance) are compounding’s best raw material, because they put maximum dollars at the start of the curve, where time is longest.

    The boring conclusion that happens to be true

    Compounding rewards exactly two behaviors: starting now, and not stopping. Everything else — rate chasing, timing, tinkering — is noise against those four numbers in the first table. $200 a month is $6.60 a day. The 40-year row is half a million dollars.


    CentSheet publishes educational content, not personalized financial advice. Projections are mathematical illustrations at an assumed constant rate, which real markets will not deliver smoothly.
  • How Big Should Your Emergency Fund Be? Not “6 Months” — It Depends on This

    How Big Should Your Emergency Fund Be? Not “6 Months” — It Depends on This

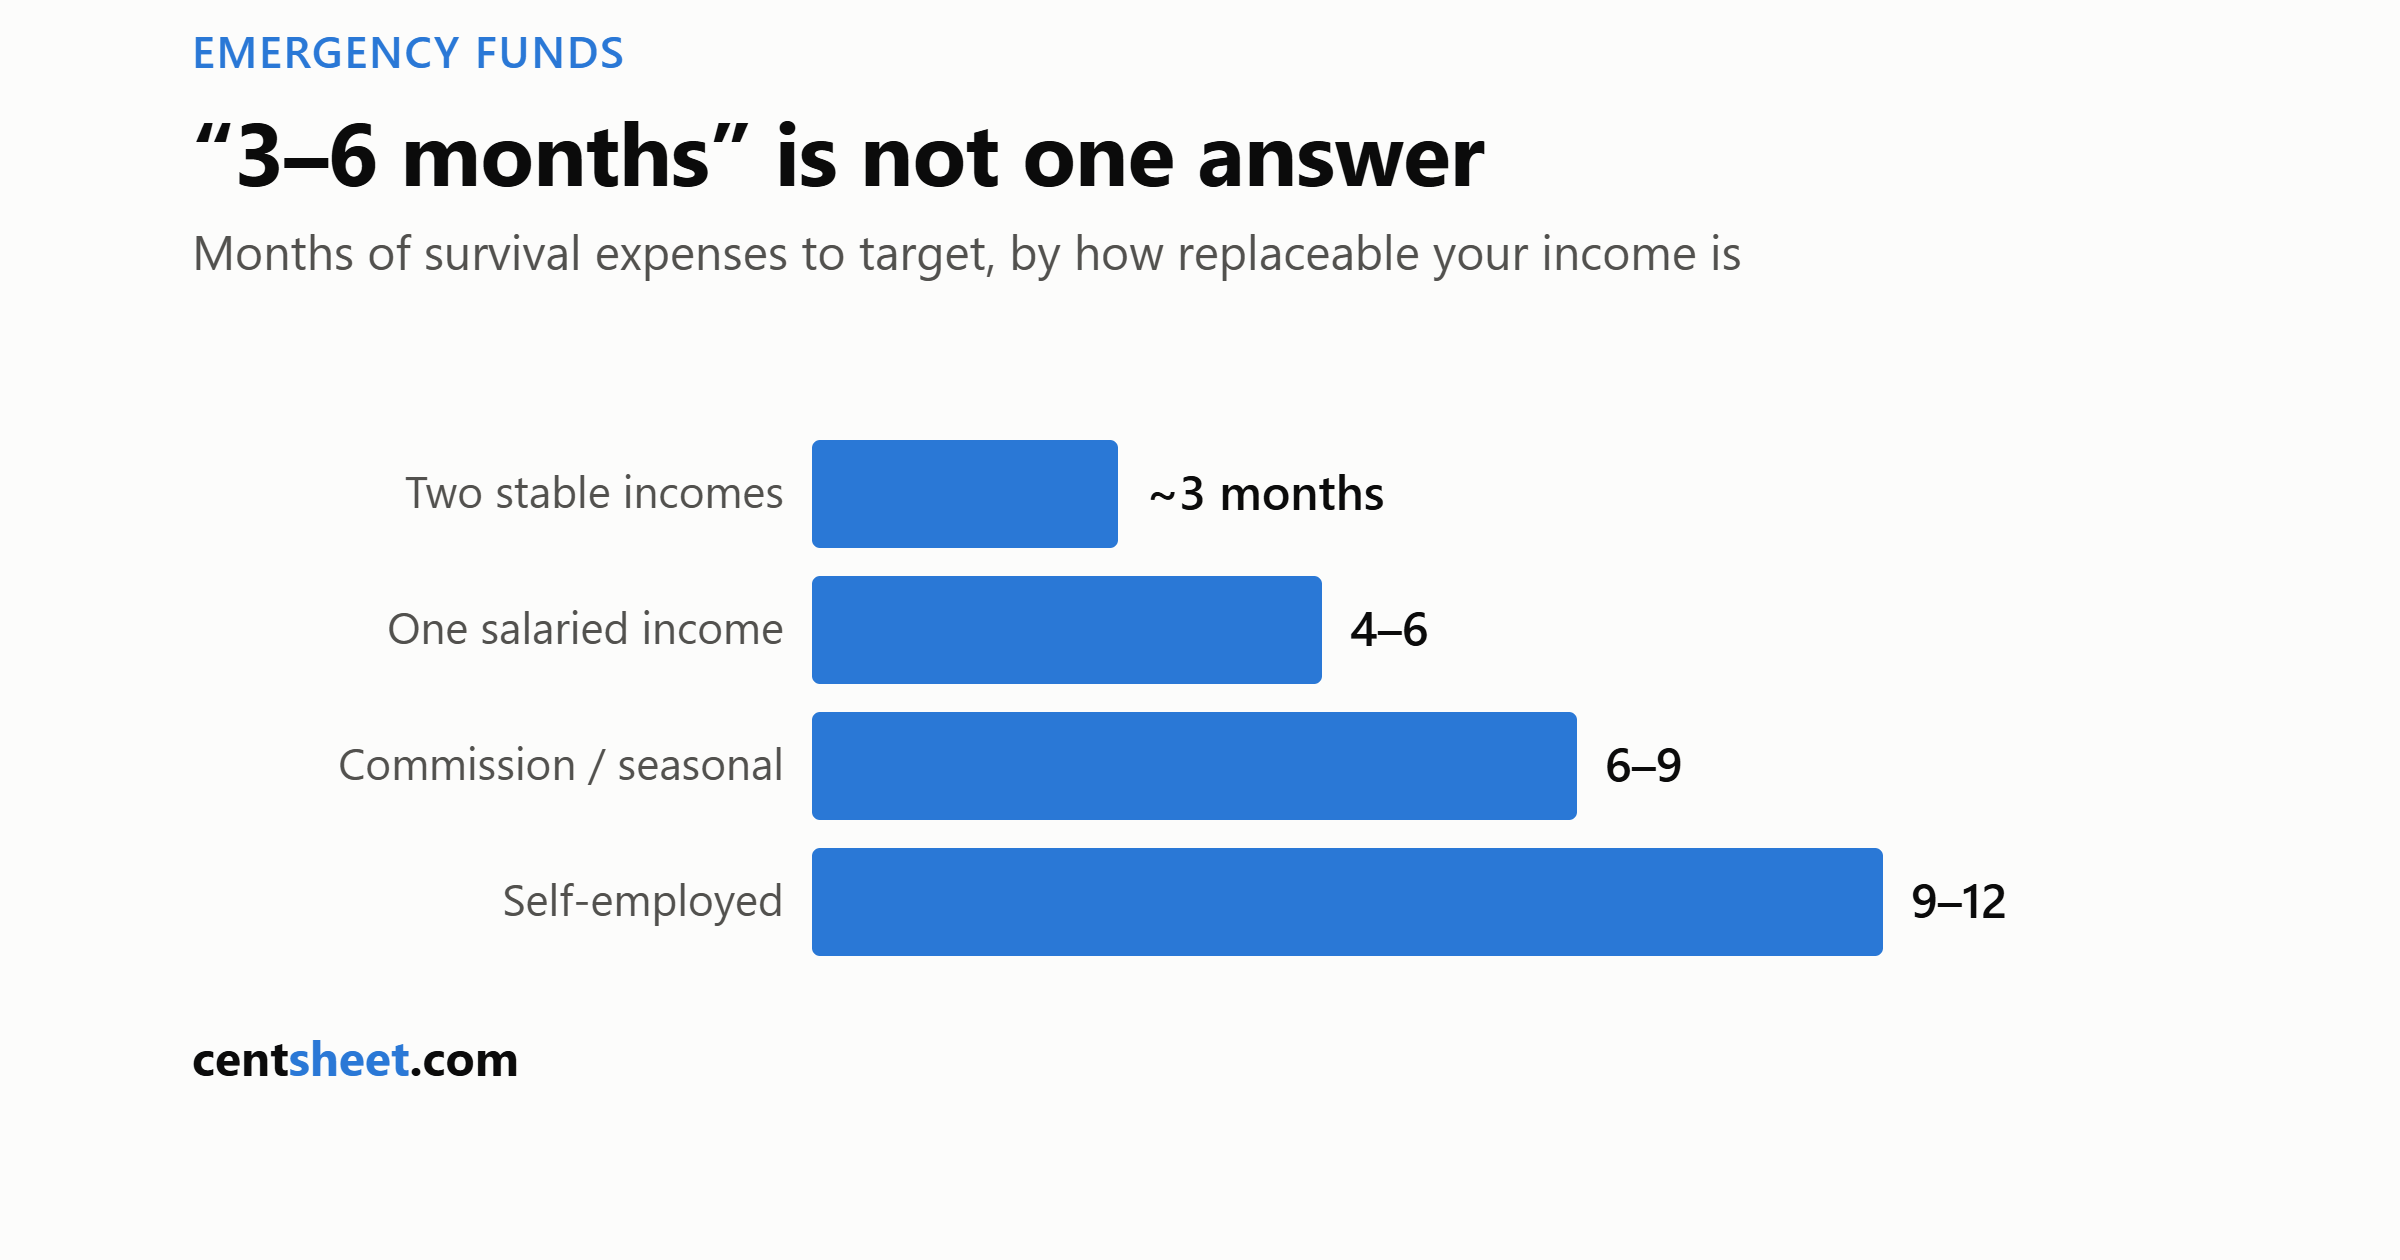
    Ask ten finance writers how big an emergency fund should be and nine will say “three to six months of expenses.” It’s the most repeated rule in personal finance, and it skips the only question that matters: three to six months of expenses against what risk?

    An emergency fund insures your income, mostly. The right size depends on how likely your income is to stop and how long it would take to replace — not on a universal number.

    Start with the right base: expenses, not income

    The fund covers what you must spend, not what you currently earn. Add up a bare-bones month: housing, utilities, food, insurance, minimum debt payments, transport, and anything contractual you can’t pause. Call that your survival number.

    If you take home $5,500/month but could keep the lights on at $3,400, your emergency fund math runs on $3,400. Using income instead of expenses inflates the target by 30–60% for most people, and an inflated target is a target you give up on.

    Then size by income stability, not by rule of thumb

    Your situation Target Why
    Two stable incomes in the household ~3 months of survival expenses Two simultaneous job losses is the tail risk, not the base case
    One stable salaried income 4–6 months One event removes 100% of income
    Commission, tips, or seasonal income 6–9 months The fund smooths normal variance and covers true emergencies
    Self-employed / contract / freelance 9–12 months Income can fall gradually, which burns runway before you react
    Single specialized income, thin job market 9+ months Time-to-replace is the driver: a niche role can take two or three quarters to rehire

    The pattern: the fund should cover realistic time-to-replace your income, plus margin. A registered nurse in a big metro can often re-employ in weeks; a specialized manager in a small industry cannot.

    Build it in stages — the full number comes later

    A $30,000 target on day one is demoralizing arithmetic. Stage it:

    Stage 1 — $1,000 starter fund, fast. This is the “stop using the credit card for surprises” fund. Most common emergencies — car repair, urgent travel, a deductible — land under this line.

    Stage 2 — one month of survival expenses. At this point a late paycheck or a bad month stops being a crisis.

    Stage 3 — your full target from the table. Automate a fixed transfer on payday and stop thinking about it. $400/month reaches a $10,200 three-month fund in about 26 months — slow is fine; the staged fund is protecting you the whole way up.

    Where to keep it

    Rules: liquid within a day or two, boring, and never invested in anything that can be down 30% the week you need it.

    • High-yield savings account — the default answer. As of August 2026, top US HYSAs pay around 4% APY while big-bank checking still pays effectively nothing. On a $10,000 fund, 4% is roughly $400/year for zero extra risk — free money for filling in one form.
    • Money market funds work similarly well inside a brokerage you already have.
    • Not the stock market. The whole point of this money is that its value on a bad day is known.
    • Not a CD ladder for the core fund — early-withdrawal penalties fight the fund’s one job, though CDs are fine for months 6–12 of an extended runway.

    The objection worth taking seriously: “but my credit card debt is at 24%”

    Correct instinct — parking $15,000 at 4% while carrying $8,000 at 24% costs you real money. The resolution most planners land on: build Stage 1 only ($1,000), attack the high-interest debt hard, then come back and build the full fund. The starter grand exists so that the next surprise doesn’t get financed at 24% and undo a year of payoff progress.

    When you actually use it

    Two rules make the fund durable. First, define an emergency before you have one: involuntary income loss, medical, essential home/car failure, family crisis. A sale is not an emergency. Second, when you do spend from it — that’s success, not failure. Refill it with the same automated transfer and move on. The fund’s job was to turn a catastrophe into an inconvenience, and it did.


    CentSheet publishes educational content, not personalized financial advice. Rates cited are illustrative and dated; check current figures before acting.
  • Debt Avalanche vs. Snowball: The Actual Math (With Calculator)

    Debt Avalanche vs. Snowball: The Actual Math (With Calculator)

    Every personal finance site tells you there are two ways to pay off debt. Almost none of them show you what the difference actually costs in dollars. Let’s fix that.

    The avalanche method says: pay minimums on everything, throw every spare dollar at the highest-interest debt first. The snowball method says: same thing, but target the smallest balance first, regardless of rate.

    Avalanche is mathematically optimal. Snowball is psychologically easier. You have heard both claims. What you probably haven’t seen is the size of the gap — so we measured it.

    The test case

    Three debts that look like a lot of real households:

    Debt Balance APR Minimum
    Credit card $8,000 24% $240
    Store card $3,500 19% $105
    Car loan $11,000 7% $260

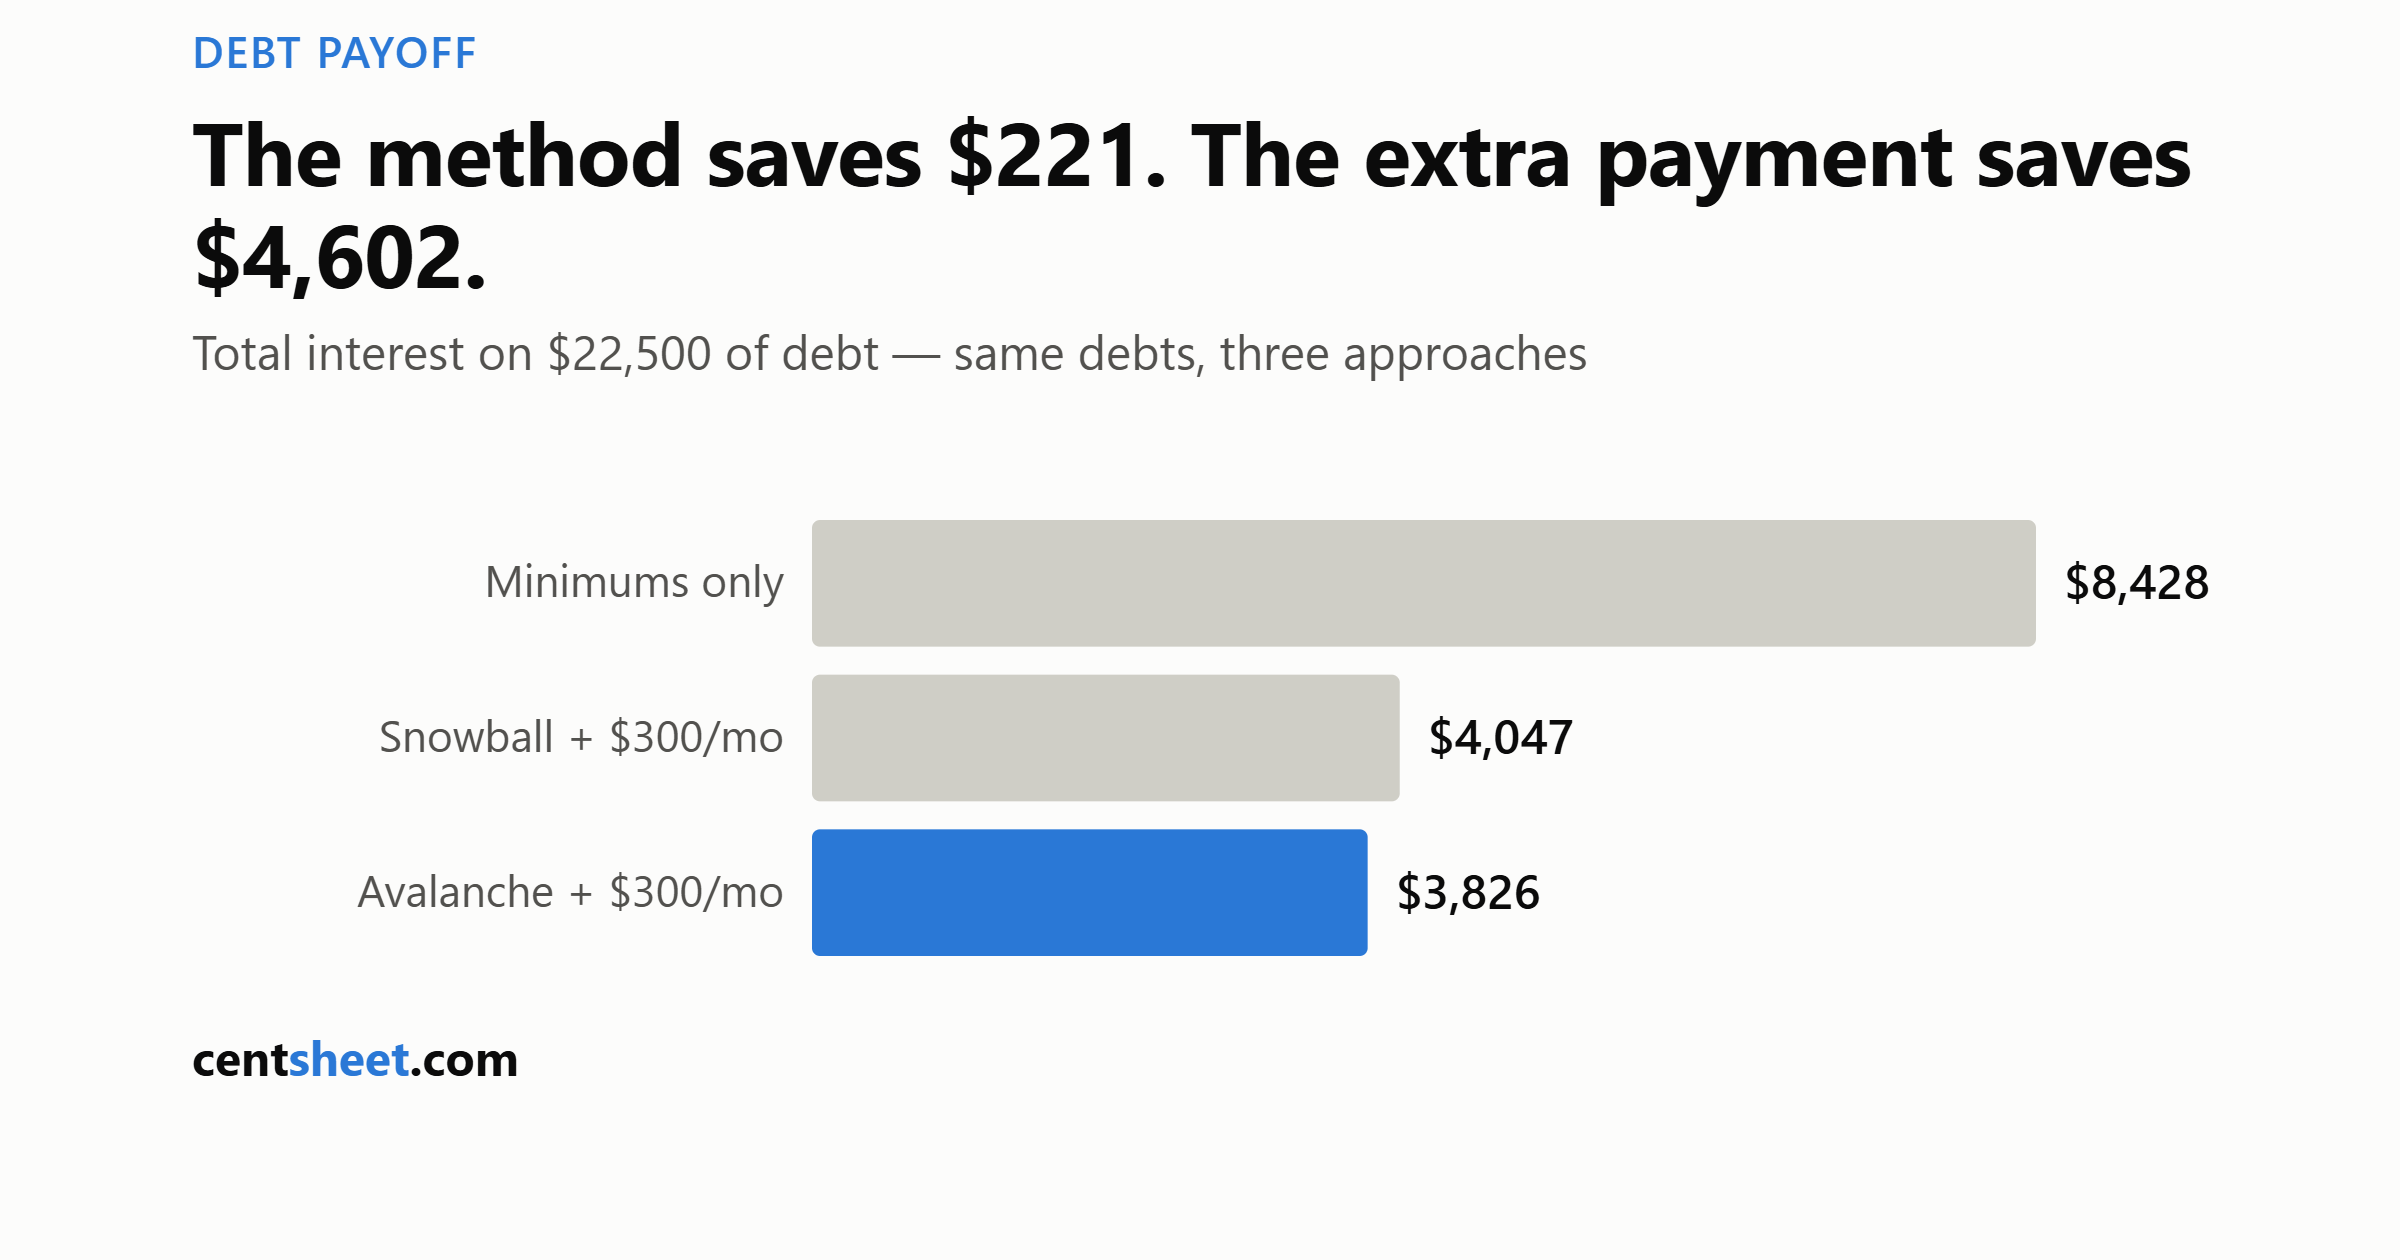
    Total: $22,500 of debt, $605/month in minimums. Suppose you can find $300/month extra. Here’s what each strategy produces, from our payoff calculator:

    Strategy Debt-free in Total interest
    Avalanche (highest APR first) 2 years 6 months $3,826
    Snowball (smallest balance first) 2 years 6 months $4,047
    Minimums only, no extra 4 years 4 months $8,428

    Two results worth staring at.

    First: the avalanche “win” is $221. Not nothing — but spread over 30 months, it’s about $7 a month. If focusing on the smallest balance first is what keeps you actually doing this for two and a half years, $7/month is a cheap price for follow-through.

    Second: the method matters far less than the extra payment. The gap between the two strategies is $221. The gap between either strategy and coasting on minimums is more than $4,400 and nearly two extra years in debt. The decision that changes your life isn’t avalanche-vs-snowball. It’s finding the $300.

    When the gap gets big

    The $221 gap is small here because the two orderings nearly agree — the highest-APR debt (24% card) is also mid-sized. The avalanche advantage grows when your debts are “inverted”: a small low-rate debt and a large high-rate one.

    Imagine a $1,500 personal loan at 6% and a $12,000 card at 27%. Snowball attacks the $1,500 first while the $12,000 compounds at 27% — and every month it waits costs you roughly $270 in interest on that card alone. In inverted situations like that, avalanche can save four figures. Run your own numbers in the calculator below; the answer depends entirely on your specific debts.

    Debt payoff calculator: avalanche vs. snowball

    Debt name Balance ($) APR (%) Min. payment ($)


    Assumes fixed APRs, fixed minimum payments, and a constant total monthly budget
    (all minimums + your extra). As each debt clears, its minimum rolls into the next target
    automatically. Educational tool — not financial advice.

    What the calculator assumes

    Honesty about the model, because payoff calculators rarely explain themselves:

    • Your total monthly budget stays constant: all minimums plus your extra. When a debt clears, its minimum payment rolls into the next target automatically. That rollover is the “snowball effect,” and it applies to both methods.
    • APRs and minimums are treated as fixed. Real card minimums shrink as balances fall — paying the original minimum throughout, as modeled here, is both simpler and slightly faster.
    • No new debt gets added along the way. The math only works if the balances only go down.

    So which one should you pick?

    The genuinely useful answer, not the diplomatic one:

    Pick avalanche if the interest-rate spread across your debts is wide (say, anything over ~10 percentage points between your highest and lowest APR), or if the dollar gap the calculator shows for your situation is meaningful to you.

    Pick snowball if you’ve tried to pay down debt before and stalled. The evidence from behavioral research is that closing an account — actually zeroing something out — is what keeps people in the game. A plan you follow beats a plan you abandon, by a margin far larger than $221.

    Either way: the extra payment is the engine. The ordering is a tuning decision.

    One warning the calculators bury

    If any debt’s minimum payment barely covers its monthly interest, minimums alone will never clear it — the balance treads water while you pay indefinitely. A $10,000 card at 25% APR accrues about $208 of interest in month one; a $200 minimum doesn’t even hold it steady. If that’s your situation, the payoff method debate is premature: the first job is getting the rate down (balance transfer, negotiation, consolidation) or the payment up. Our calculator flags this case explicitly rather than showing you a fantasy payoff date.


    CentSheet publishes educational content, not personalized financial advice. Numbers above are illustrative model outputs; your card agreement’s actual minimum-payment formula and rate changes will alter real-world results.