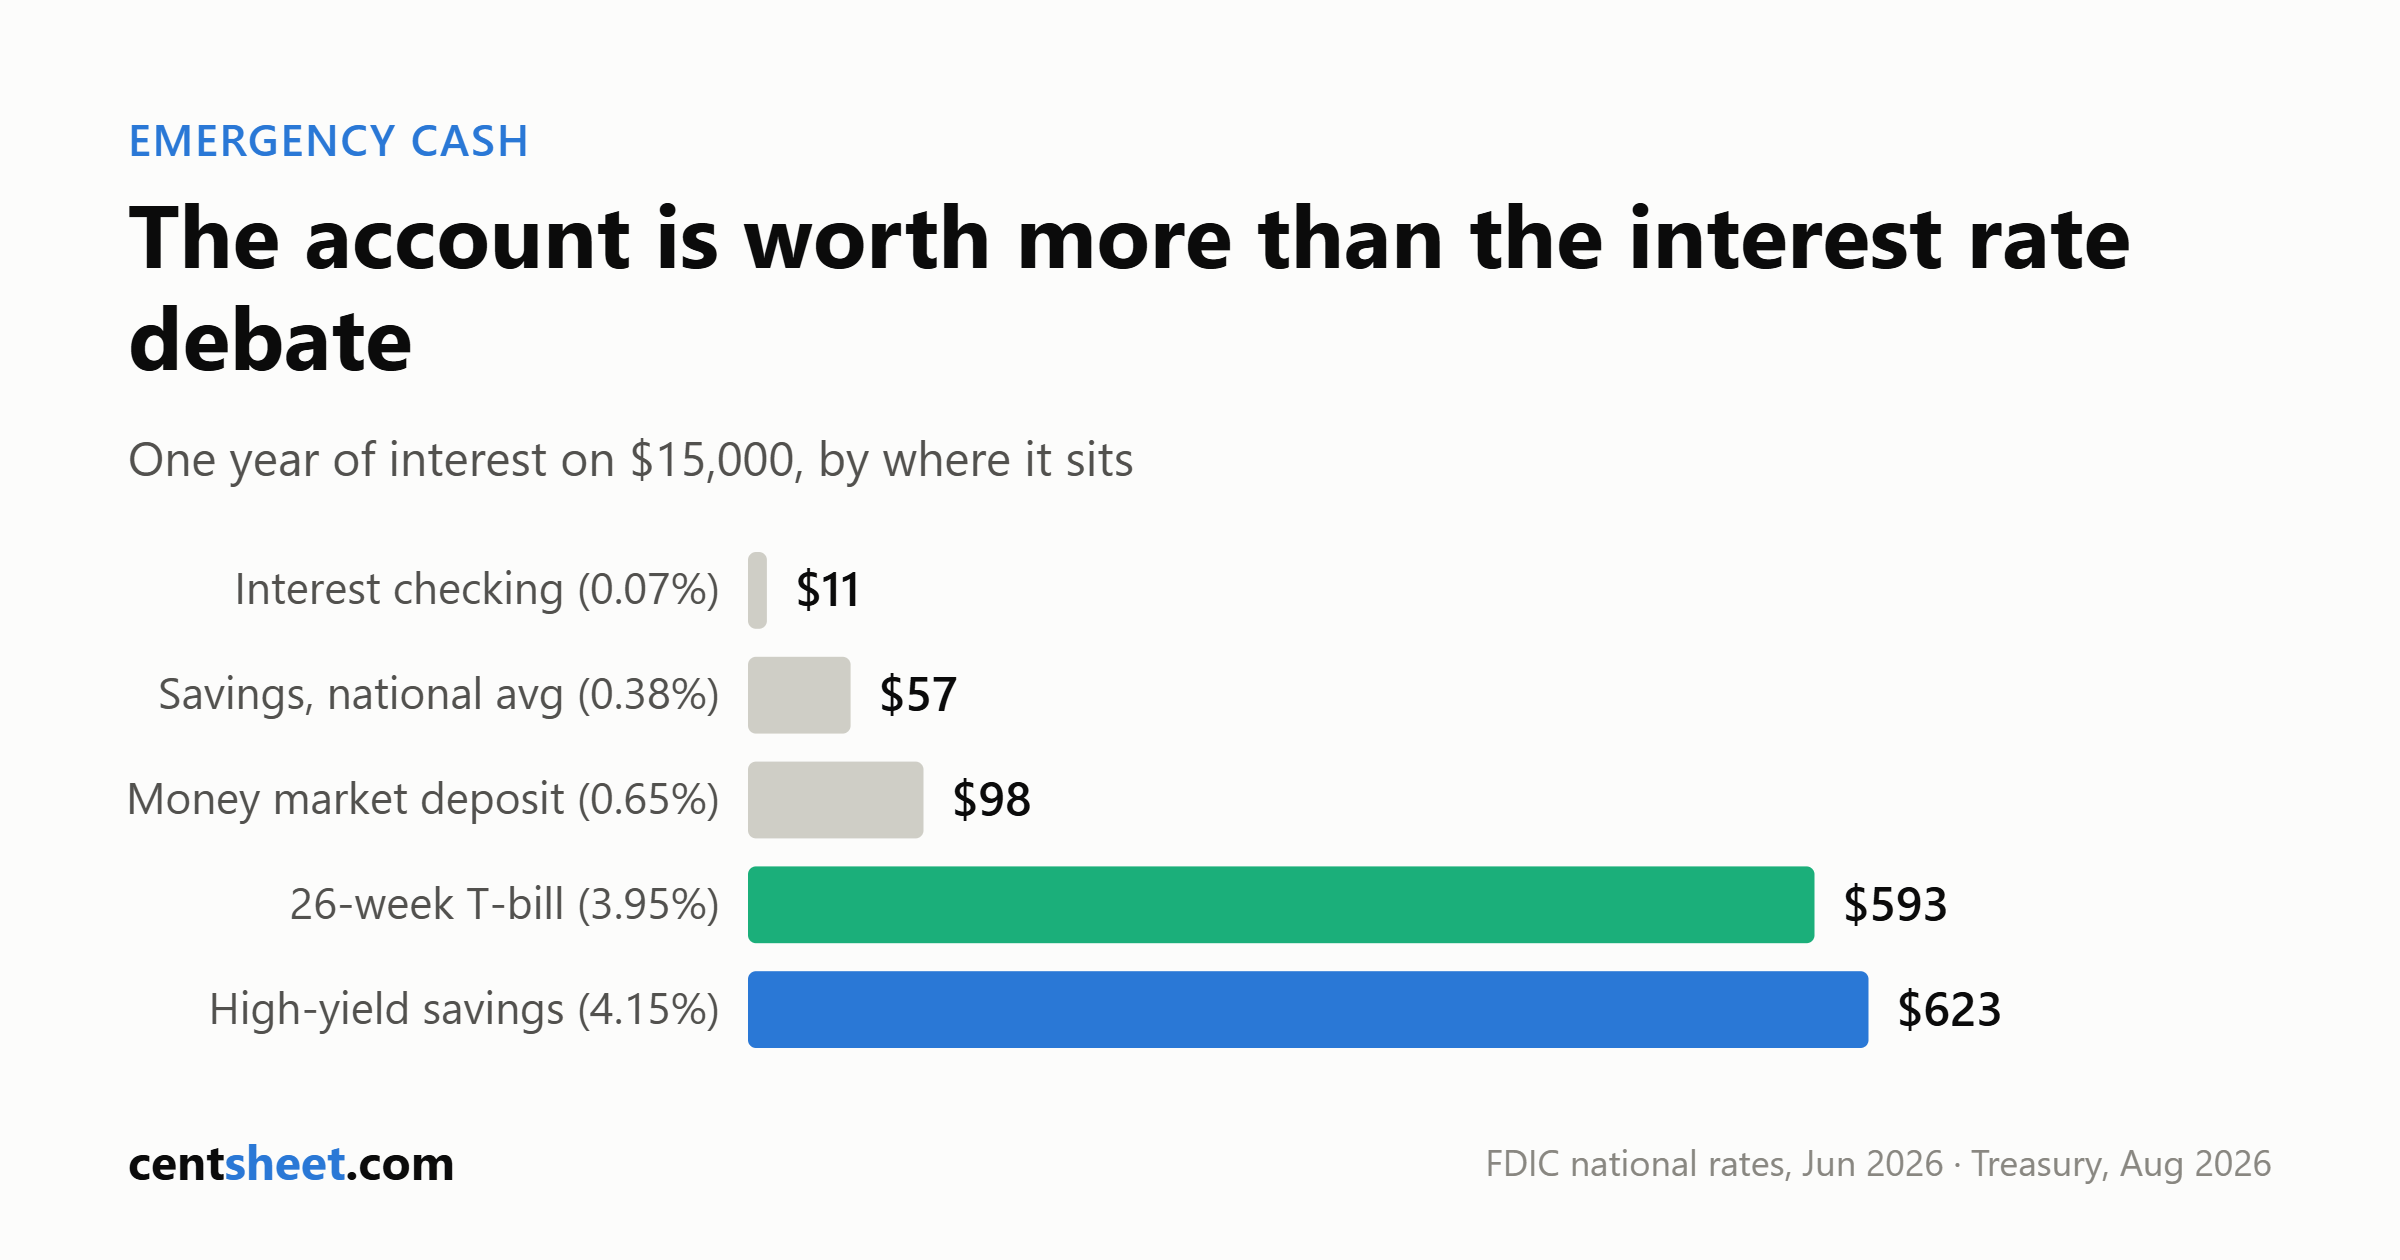
The FDIC publishes a national average savings rate. In the release dated July 20, 2026 — which, per the FDIC’s own methodology, reflects data from the last business day of the prior month, so roughly June 30, 2026 — that average was 0.38%. The same release put money market deposit accounts at 0.65% and interest checking at 0.07%.
Those are deposit-weighted averages across every insured institution the FDIC has data for, not what a competitive online savings account paid that week. The gap between where most emergency cash sits and where it could sit — identical federal insurance, identical same-day access — is the largest free win in consumer finance. No risk, no lockup, no skill.
Insurance comes before yield
An emergency fund exists for the worst day of your year. Certainty is the feature you are buying; yield is the rebate for shopping carefully.
FDIC insurance is $250,000 per depositor, per insured bank, for each ownership category, and coverage is automatic. Per the FDIC’s own summary that means $250,000 per owner on single accounts, per co-owner on joint accounts, and per owner on certain retirement accounts including IRAs, regardless of how many beneficiaries are named.
Trusts run on their own formula, changed April 1, 2024: owners × distinct eligible beneficiaries × $250,000, capped at $1,250,000 per owner at one bank, so at most five beneficiaries count. Any description of unlimited per-beneficiary trust coverage predates that rule.
Credit unions are not FDIC-insured. They are covered by the National Credit Union Share Insurance Fund, run by the NCUA, established by Congress in 1970 and — like the FDIC fund — backed by the full faith and credit of the United States. Same $250,000 headline, automatic on joining, but the fine print differs: NCUA covers a member’s interest in all joint accounts combined to $250,000 and attaches a membership condition the FDIC does not. Do not map one agency’s fine print onto the other.
The exclusion list is more useful. The FDIC states that stocks, bonds, mutual funds, crypto assets, life insurance, annuities, municipal securities and U.S. Treasury bills, bonds and notes are not covered, even when bought through an insured bank. NCUA’s list is materially the same. That is no knock on Treasuries, which carry the government’s full faith and credit directly. It is a knock on “it’s at my bank, so it’s insured.”
Settle the size before the location — see how much to keep in an emergency fund and the emergency fund calculator.
What the national average measures, and the 4.38% trap
The FDIC national rate is deposit-weighted: an average of what all insured banks and credit unions with available data pay, weighted by each institution’s share of domestic deposits, on $2,500 product tiers for savings. That weighting lets the largest deposit books dominate, and those are largely the banks paying least. The figure describes where the money is, not what is available. It republishes on the third Monday of each month.
On the same page sits a second number — a 4.38% national rate cap. It is not a market rate. It is a supervisory ceiling on what a less-than-well-capitalized institution may pay. For a non-maturity deposit — a savings or money market account — the FDIC sets it at the higher of the national rate plus 75 basis points, or the federal funds rate plus 75 basis points; the 120%-of-comparable-maturity-Treasuries-plus-75-basis-points formula applies to certificates of deposit. It appears in articles dressed as an achievable yield. It is not one.
The gap, in dollars
CentSheet’s arithmetic on $15,000 held one year. Assumptions: simple interest, no compounding, no tax, constant rate. None hold exactly — variable savings rates change without notice.
| Where it sits | Rate and date | Interest on $15,000 |
|---|---|---|
| Interest checking, national average | 0.07% (FDIC, data ~2026-06-30) | $10.50 |
| Savings, national average | 0.38% (FDIC, data ~2026-06-30) | $57.00 |
| Money market deposit, national average | 0.65% (FDIC, data ~2026-06-30) | $97.50 |
| 26-week T-bill, coupon equivalent | 3.95% (Treasury, 2026-08-05) | $592.50 |
| Low end, advertised high-yield range | 4.15% (Yahoo Finance, 2026-08-05, unverified) | $622.50 |
| High end, advertised high-yield range | 4.50% (Motley Fool, 2026-08-03, unverified) | $675.00 |
From the national-average savings row to the low end of the advertised high-yield row is $565.50 a year. That is the whole argument.
Nobody agrees on what the top rate is
We tried to print one number for the best available high-yield savings APY and could not do it honestly. In the first week of August 2026, five aggregators published different answers: Motley Fool said up to 4.50% (Aug 3); CNBC Select and NerdWallet both said up to 4.21%; Branchspot named 4.20% at one bank with a $5,000 minimum; Yahoo Finance said up to 4.15% (Aug 5). WalletHub advertised “Up to 10.00%” — almost certainly a capped promotional or rewards-checking product, not a comparable savings APY.
That is a 35-basis-point spread among the credible four, in one week, describing the same market. We did not fetch any bank’s own rate disclosure, so none is verified at source and we treat none as fact. Each page earns money when you click through — not a scandal, just the business model, and the reason the headline tracks whatever is most attractive that week. See APR vs APY on comparing quoted rates.
Money market funds and money market deposit accounts are different products with the same name
The most expensive naming collision in retail finance. A money market deposit account is a bank deposit; the FDIC lists it as insured alongside checking, savings and CDs. A money market fund is a mutual fund. The SEC is explicit: “Money invested in a money market fund, like money invested in any mutual fund, is not guaranteed by the FDIC,” and warns that fund investors may lose some or all of their money because a fund’s holdings can fall in value.
Money market funds are not dangerous; they are simply not guaranteed. Stable-NAV funds can break the buck if net asset value moves more than half a cent from $1.00. Institutional prime and institutional tax-exempt funds must float their NAV rather than hold $1.00 — that rule covers institutional funds, not retail investors — and institutional funds must charge a liquidity fee when daily net redemptions exceed 5% of net assets.
For tier-one money, what matters is not which pays more but which carries a federal guarantee on the exact dollars you need on a bad Tuesday.
Treasury bills, and the tax point that gets oversold
Bills are sold at a discount or at par; the interest is the gap between price and face value at maturity. Terms run 4, 6, 8, 13, 17, 26 and 52 weeks, minimum $100 in $100 increments. Treasury’s daily feed for August 5, 2026:
| Term | Discount rate | Coupon equivalent |
|---|---|---|
| 4-week | 3.62% | 3.68% |
| 13-week | 3.74% | 3.83% |
| 26-week | 3.82% | 3.95% |
| 52-week | 3.85% | 4.02% |
The coupon equivalent is the column comparable to a savings APY; the discount rate is a different convention and ran 6 to 17 basis points lower here. Quoting the discount rate against an APY understates the bill.
These age in days. Over five business days from July 31 to August 5, 2026, the 52-week coupon equivalent went 4.02 → 4.06 → 4.06 → 4.04 → 4.02. Any T-bill yield in an evergreen article is wrong by the time it is read, including the table above.
T-bill interest is subject to federal income tax and exempt from state and local income tax. It is not “tax free,” and the exemption is worth nothing in a state with no income tax. What it is worth to anyone else depends on their state and marginal bracket, so we are not computing a tax-equivalent yield here.
The real cost is structural. A 26-week bill locks the money for 26 weeks unless you sell on the secondary market at that day’s price — fine for the back half of a large fund, wrong for the part you might need Thursday. HYSA vs CD vs T-bills works through the trade-off.
The six-withdrawal limit is no longer federal, and may still be yours
Regulation D’s six-per-month cap on convenient transfers from savings is not a federal requirement. The Federal Reserve’s interim final rule of April 24, 2020 deleted it from the definition of “savings deposit” after reserve requirement ratios were cut to zero, and the Fed states it “does not have plans to re-impose transfer limits.”
But the rule permits institutions to suspend enforcement — it does not require them to. Your bank may still cap transfers and charge excess-transfer fees if its account agreement says so. The accurate line is “no longer federally mandated, possibly still in your account agreement,” not “abolished.” We could not verify the codified text at 12 CFR 204.2(d) either: federalregister.gov and ecfr.gov both redirect to an anti-bot page. The change has not been reversed as of August 6, 2026, but we will not call the rule permanent when we could not read it.
I bonds are a good product and a bad emergency fund
Series I savings bonds issued from May 1, 2026 through October 31, 2026 carry a composite rate of 4.26%, built from a 0.90% fixed rate and a 1.67% semiannual inflation rate. Treasury’s May 1 press release states the same inflation component as 3.34% annualized. Both are correct and describe the same CPI-U movement, but only 1.67% plugs into the composite formula — if you see 3.34% used as the semiannual figure, that source has doubled it. The next rate is set November 1, 2026 and is unknown.
The disqualifying facts are not about the rate:
- The bond cannot be redeemed at all for the first 12 months. Not with a penalty — at all.
- Redeem before five years and you forfeit the last three months of interest. Cash out at 18 months, keep 15 months of interest.
- Electronic purchases are capped at $10,000 per calendar year per Social Security number, separate from the $10,000 EE limit.
An asset you cannot touch for a year is not an emergency fund by definition. It can suit money one layer back — closer to a sinking fund than to cash.
One stale tip to retire: as of January 1, 2025 you can no longer buy paper Series I bonds with a tax refund. Treasury cited cost, fraud risk and uptake under 1% of Series I purchases. The “$5,000 extra via your refund” line, and the “$15,000 combined limit” behind it, are now false.
What to actually do
1. Fix the size of the fund first. Location optimizes a number you have not set yet. 2. Put the first tier — money you might need this week — in a high-yield savings account or MMDA at an FDIC-insured bank or NCUA-insured credit union. Confirm it is a deposit, not a fund. 3. Read the rate on the institution’s own disclosure the day you open it, with the balance tier and any minimum. Aggregator numbers, including the ones above, are not verified. 4. Do not chase the last 20 basis points. Moving off a 0.38%-type account is worth hundreds a year; moving between two competitive accounts is a rounding error. 5. Check your account agreement for transfer limits and excess-transfer fees before assuming the six-per-month rule is gone. 6. If the fund is large, use T-bills or a CD ladder for the back portion only, and keep a month of expenses in something you can move today. 7. Keep I bonds out of tier one. The 12-month lockup ends the discussion. 8. If a balance approaches $250,000 at one institution, read that insurer’s own ownership-category rules. FDIC and NCUA are close, not interchangeable.
The biggest available gain here is also the dullest: one transfer that takes an afternoon and then never needs attention again. Everything downstream of it costs more thought and pays less.
CentSheet publishes educational content, not personalized financial advice, and nothing here is tax advice. Every rate cited is dated at the point of use and was current only as of that date; deposit rates and Treasury yields move without notice.
Get the CentSheet Money Brief
Email me CentSheet weekly: practical money decisions, new calculators, and useful worksheets. Unsubscribe anytime.