Saving money fast is a different problem from saving money. The deadline rules out most of what gets published under this headline.
Start with the number the genre rests on. In the Federal Reserve’s 2025 Survey of Household Economics and Decisionmaking — fielded October 17-28, 2025, published May 2026 — 63 percent of adults said they would cover a hypothetical $400 emergency expense exclusively with cash, savings, or a credit card paid off at the next statement. The other 37 percent would cover it another way: a carried balance, borrowing, selling something. Twelve percent said they could not pay it by any means. The familiar “four in ten Americans can’t afford a $400 emergency” line misstates the Fed’s measure — the question asks how people would cover it, not whether they could. Three situations, sorted below by speed.
What can move this week
Recurring charges are the fastest thing to cut, for structural reasons rather than psychological ones: they renew on a cycle, cancelling needs nobody’s agreement, and the effect lands within days. Hence the subscription audit.
What we will not do is tell you how much it saves. Nobody publishes that number. Every “the average household wastes $X a month on forgotten subscriptions” figure traces to a budgeting app, a bank blog, or a cash-back company — all selling something, none publishing a method. Bill negotiation is the same: the scripts work or don’t depending on provider, tenure and zip code.
One adjacent number is real. As of July 20, 2026, the FDIC’s national average rate was 0.38 percent for savings accounts and 0.65 percent for money market accounts. Money already saved earns close to nothing, and moving it costs nothing. Ignore the 4.38 percent “national rate cap” in the same table — a supervisory ceiling for weakly capitalized institutions, not a rate on offer. See HYSA vs CD vs T-bills and read APY, not APR.
What can move this month
Food is the largest genuinely variable line for most households, and where the advice is worst. The BLS Consumer Expenditure Survey for 2024 — released December 19, 2025, the newest annual data — puts mean spending at $6,224 on food at home and $3,945 on food away from home, over consumer units averaging 2.4 people. Those are means, not medians. The away-from-home figure is about $329 a month (CentSheet’s arithmetic: $3,945 divided by 12, assuming an even spread that real spending does not have).
Two federal sources point opposite ways. USDA’s Economic Research Service reports that in 2025 Americans spent $1.41 trillion on food away from home against $1.10 trillion at home — more on restaurants than groceries. BLS says the reverse for households. ERS counts all purchasers — households, government food assistance, business and employer-provided meals, home production and donations — with taxes and tips. BLS counts self-reported household out-of-pocket spending. Neither is wrong, but quoting the restaurant statistic over a household budget blends them.
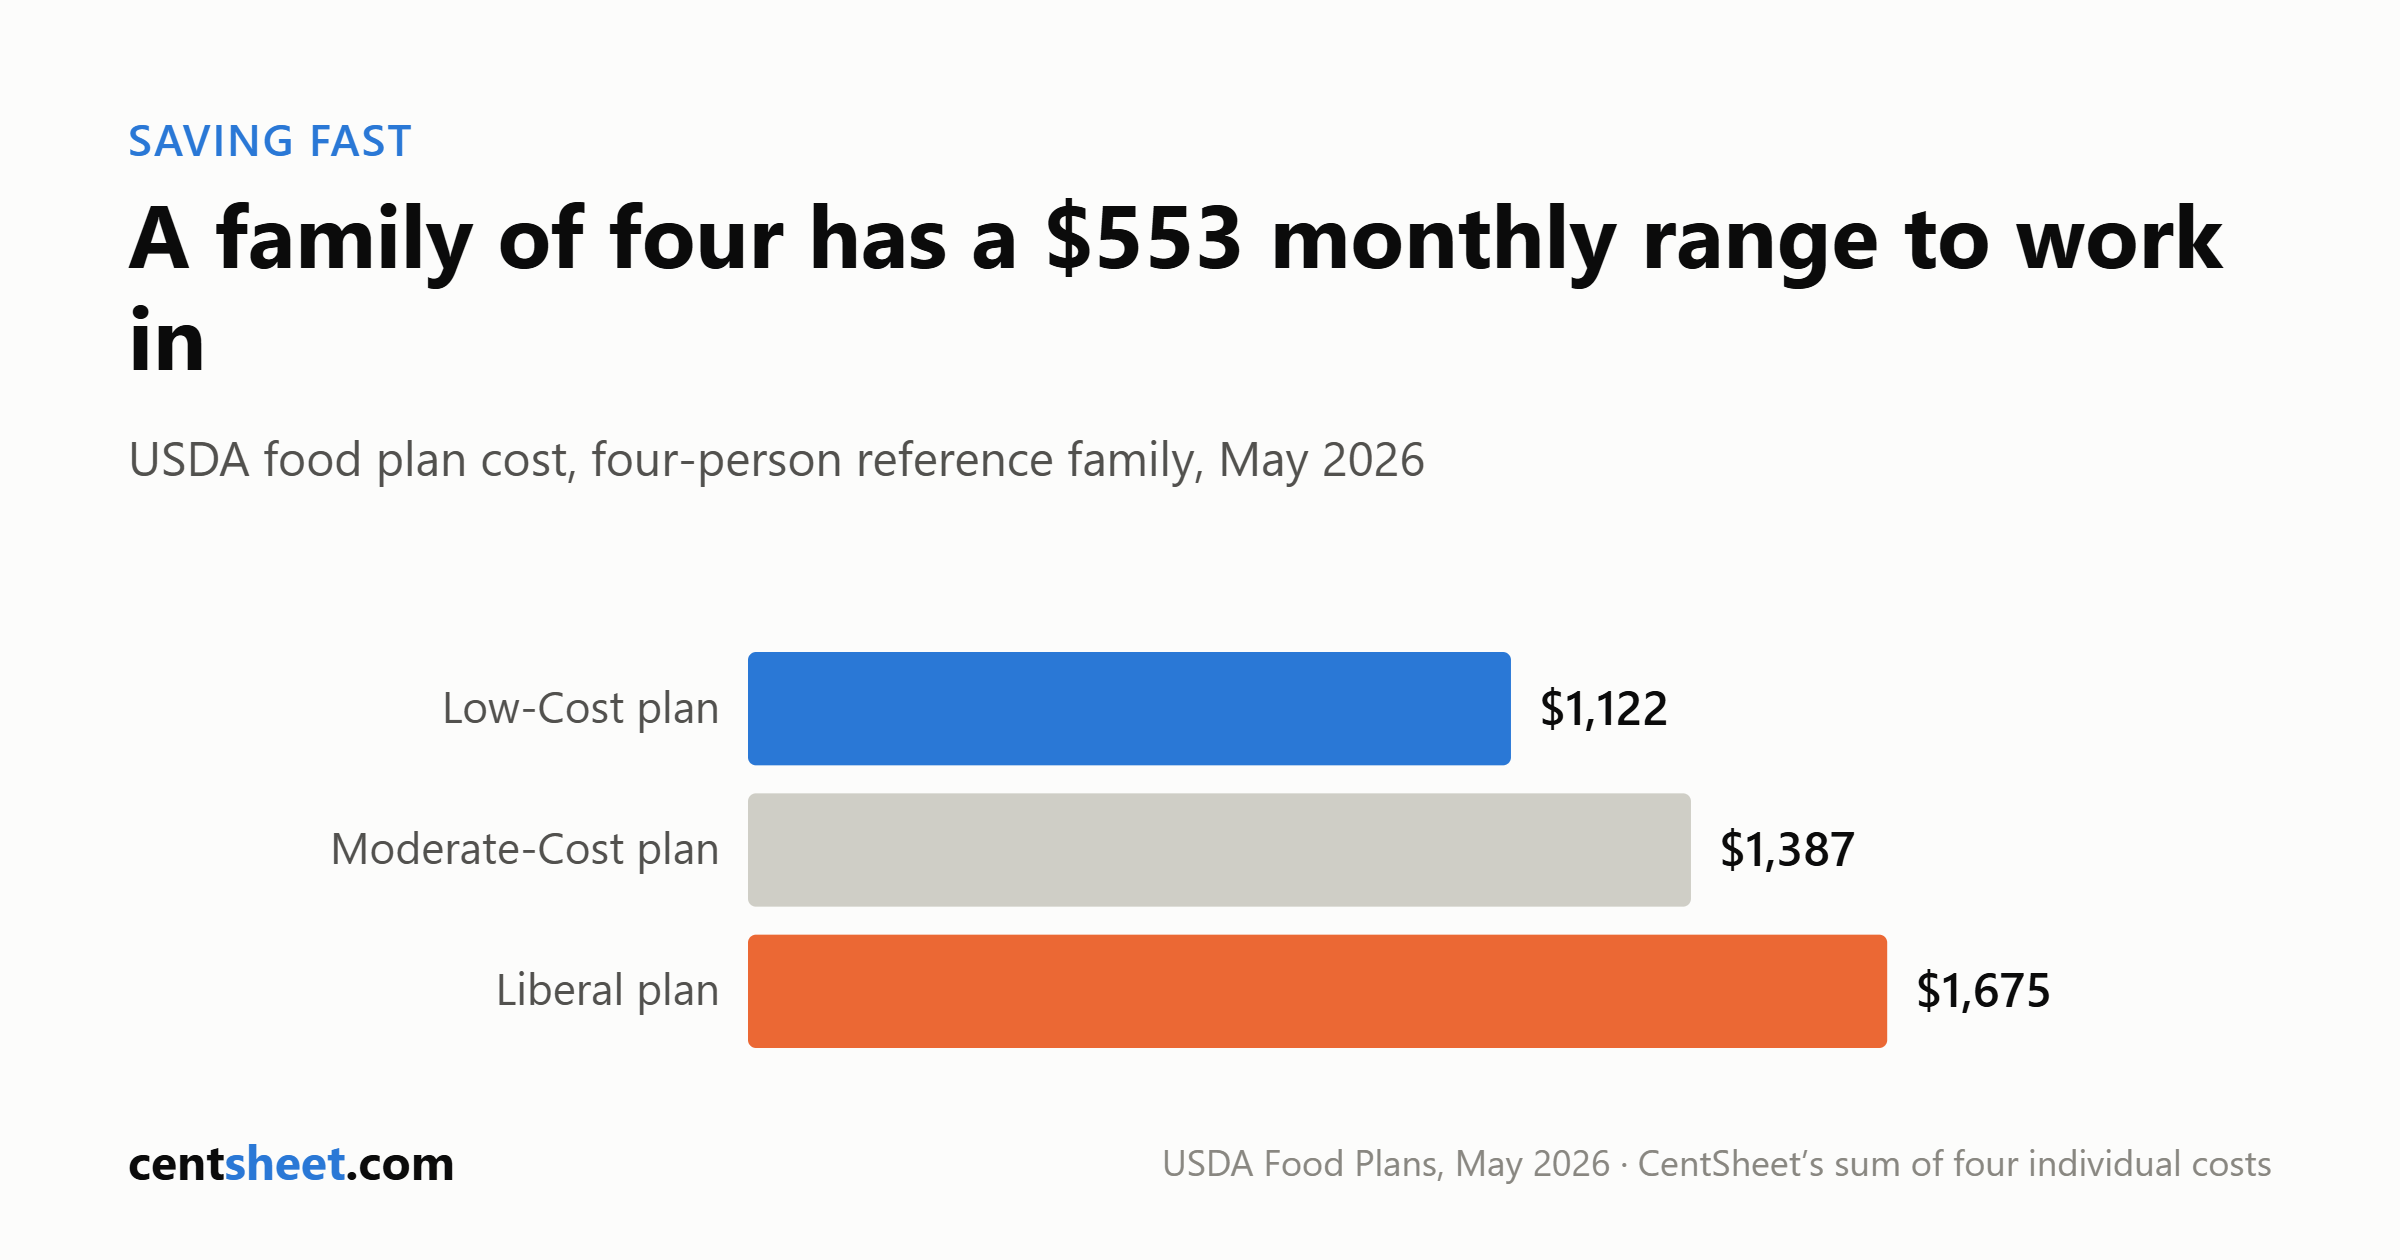
USDA’s food plans are a normative benchmark, not an observed one. For May 2026 (issued June 2026), the Thrifty Food Plan reference family — a man and woman aged 20-50 plus children aged 6-8 and 9-11 — costs $1,018.20 a month, or $235.00 a week. The other three plans appear in a separate report, per person:
| Monthly cost, May 2026 | Low-Cost | Moderate-Cost | Liberal |
|---|---|---|---|
| Male 19-50 | $316.00 | $397.00 | $484.60 |
| Female 19-50 | $274.80 | $335.60 | $427.90 |
| Child 6-8 | $261.30 | $304.30 | $355.50 |
| Child 9-11 | $269.90 | $349.80 | $407.30 |
| Four-person total (CentSheet’s sum) | $1,122.00 | $1,386.70 | $1,675.30 |
Those totals are ours, not USDA’s: we summed the four per-person figures, and USDA’s household-size adjustment is zero at four people. USDA publishes a family total for the Thrifty plan alone. Third-party sites circulate their own — roughly $1,347 a month for moderate-cost is common — and disagree with each other because they sum different age brackets.
Three caveats USDA states itself and most citations drop. All four plans assume every meal and snack is prepared at home: no restaurants, no takeout, no coffee out. The Low-Cost, Moderate-Cost and Liberal plans rest on 2001-02 consumption data with 2005-era dietary guidance; the Thrifty plan on 2013-16 consumption and 2015-16 prices. Only the CPI price adjustment is current. And they are nutrition-adequacy targets, not descriptions of what anyone spends. Grocery budget math covers your own number.
The one food lever with a sourced dollar figure is waste. EPA’s April 2025 report puts the cost of wasted food at $728 per person per year, or $14 a week — food bought and never eaten — roughly 11 percent of a consumer’s food spending. Its household-of-four figure of $2,913 is that per-capita number multiplied by four, and EPA notes per-capita waste generally falls as household size rises, so it likely overstates a real four-person household. The estimate rests on 2023 retail prices and excludes rice, which EPA says biases it low. It replaced the roughly $1,500-per-household figure still circulating, from a 2014 USDA analysis on 2010 prices.
Insurance re-shopping is month-scale: quotes take time. BLS puts mean 2024 healthcare spending at $6,197 per consumer unit, $4,055 of it health insurance premiums; renters insurance is where people most often find coverage they never re-priced. Again, no published average exists for what re-shopping saves.
One thing that looks fast and is not: cutting your tax withholding. It raises take-home pay without raising annual income and can create a bill later. That is cash flow, not saving — ask a tax professional first.
What cannot be rushed
In 2024, housing was 33.4 percent of total annual expenditures for all consumer units, transportation 17.0 percent, food 12.9 percent, healthcare 7.9 percent. Note the denominator: shares of total spending, not of income. BLS published no after-tax income estimates for 2024 at all — the outside tax model it uses was not updated for that tax year — so the share-of-take-home version cannot be computed. The distribution matters more than the average:
| Share of total expenditures, 2024 | Lowest fifth by income | Highest fifth | All consumer units |
|---|---|---|---|
| Housing | 41.6% | 29.3% | 33.4% |
| Food at home | 11.0% | 6.2% | — |
| Food away from home | 4.7% | 5.1% | — |
| Healthcare | 9.8% | 6.5% | 7.9% |
| Transportation | 14.6% | 16.9% | 17.0% |
Grocery spending falls sharply as income rises — 11.0 percent of the lowest fifth’s spending against 6.2 percent of the highest fifth’s — while restaurant spending stays nearly flat, 4.7 to 5.1 percent. Telling people to drop takeout targets the food line that barely varies by income.
Housing is the wall. HUD calls a household cost burdened above 30 percent of monthly income on housing including utilities, severely cost burdened above 50 percent — a share of income, a different denominator from the table above. Rent is not cancellable this month; neither is a car loan, a commute, or a premium in force. If fixed costs are 70 percent of your spending, cutting the flexible 30 percent by a fifth moves the total by six.
The fastest lever is usually income, not further cutting
The genre avoids this part, because nothing is sold alongside it. In the 2025 SHED, 41 percent of adults said they always or often had money left over at month end, unchanged from 2024 — while 32 percent said their family’s monthly income had risen from a year earlier and a higher 35 percent said their spending had.
| Family income (SHED 2025) | Money left over at month end | 3-month rainy day fund | Doing okay or living comfortably |
|---|---|---|---|
| Less than $25,000 | 19% | 21% | 45% |
| $25,000-$49,999 | 26% | 39% | 55% |
| $50,000-$99,999 | 38% | 55% | 74% |
| $100,000 or more | 59% | 75% | 91% |
| All adults | 41% | 55% | 73% |
Those are the Fed’s income brackets, not quintiles, and self-reported. Overall, 55 percent of adults had a rainy day fund covering three months of expenses — unchanged from 2024, below the 59 percent high of 2021.
The arithmetic of speed favors income. A one-time $600 closes a $600 gap in one step; cutting $50 a month takes twelve months to get there, and only if it holds every month (CentSheet’s arithmetic: $50 x 12 = $600, no month skipped). Overtime, a short contract, an extra shift, selling something you own — unglamorous, and usually faster than the cuts you have not made.
When cutting cannot close the gap
Twelve percent of adults in the 2025 SHED said they could not cover a $400 expense by any means. For them the first two sections here are not the answer, and neither is any other article’s.
In 2024, the lowest fifth of consumer units reported mean pre-tax income of $16,658 against mean expenditures of $35,046 — more than double. That gap is a long-documented feature of the survey rather than evidence of bad budgeting: income underreporting, non-cash transfers, asset drawdown, borrowing, irregular income, retirees spending savings. BLS does not endorse a simple overspending reading, and neither do we.
For scale, BEA reported a national personal saving rate of 2.7 percent for June 2026, released July 30, 2026 — against the 20 percent savings share in the 50/30/20 split popularized by the 2005 book All Your Worth. The BEA figure is a national accounts aggregate, total personal saving over total disposable personal income, dominated by high earners. It is not a household mean and not a median. It says only that the target and the aggregate outcome are nowhere near each other. Put that rule through the 50/30/20 stress test first.
When the shortfall is structural rather than behavioral, the work changes: getting out of paycheck to paycheck means moving the fixed side of the ledger, which does not happen in thirty days.
The short version
1. Decide what “fast” means in days, then only consider levers that clear that deadline. A cut that pays off in month eleven is no answer to a Friday bill. 2. This week: cancel recurring charges and move idle cash. The FDIC national average savings rate was 0.38 percent as of July 20, 2026. Do it because it is fast and reversible, not because of an unsourced figure. 3. This month: cut food waste and restaurant spending against a stated target, re-shop insurance, and set a grocery number using USDA’s May 2026 plans as a ceiling rather than a norm. 4. Do not count withholding changes as saving. They move money forward, not upward. 5. Housing, transportation and healthcare will not move in thirty days. For the lowest fifth of households by income, housing alone was 41.6 percent of total spending in 2024. 6. If the gap is bigger than your flexible spending, a temporary income increase is the faster lever, and saying so is not a judgment about your budgeting. 7. Size the target first. The emergency fund calculator tells you whether you are chasing $400 or $4,000; how much you need sets the longer one.
CentSheet publishes educational content, not personalized financial advice, and nothing here is tax advice.
Get the CentSheet Money Brief
Email me CentSheet weekly: practical money decisions, new calculators, and useful worksheets. Unsubscribe anytime.