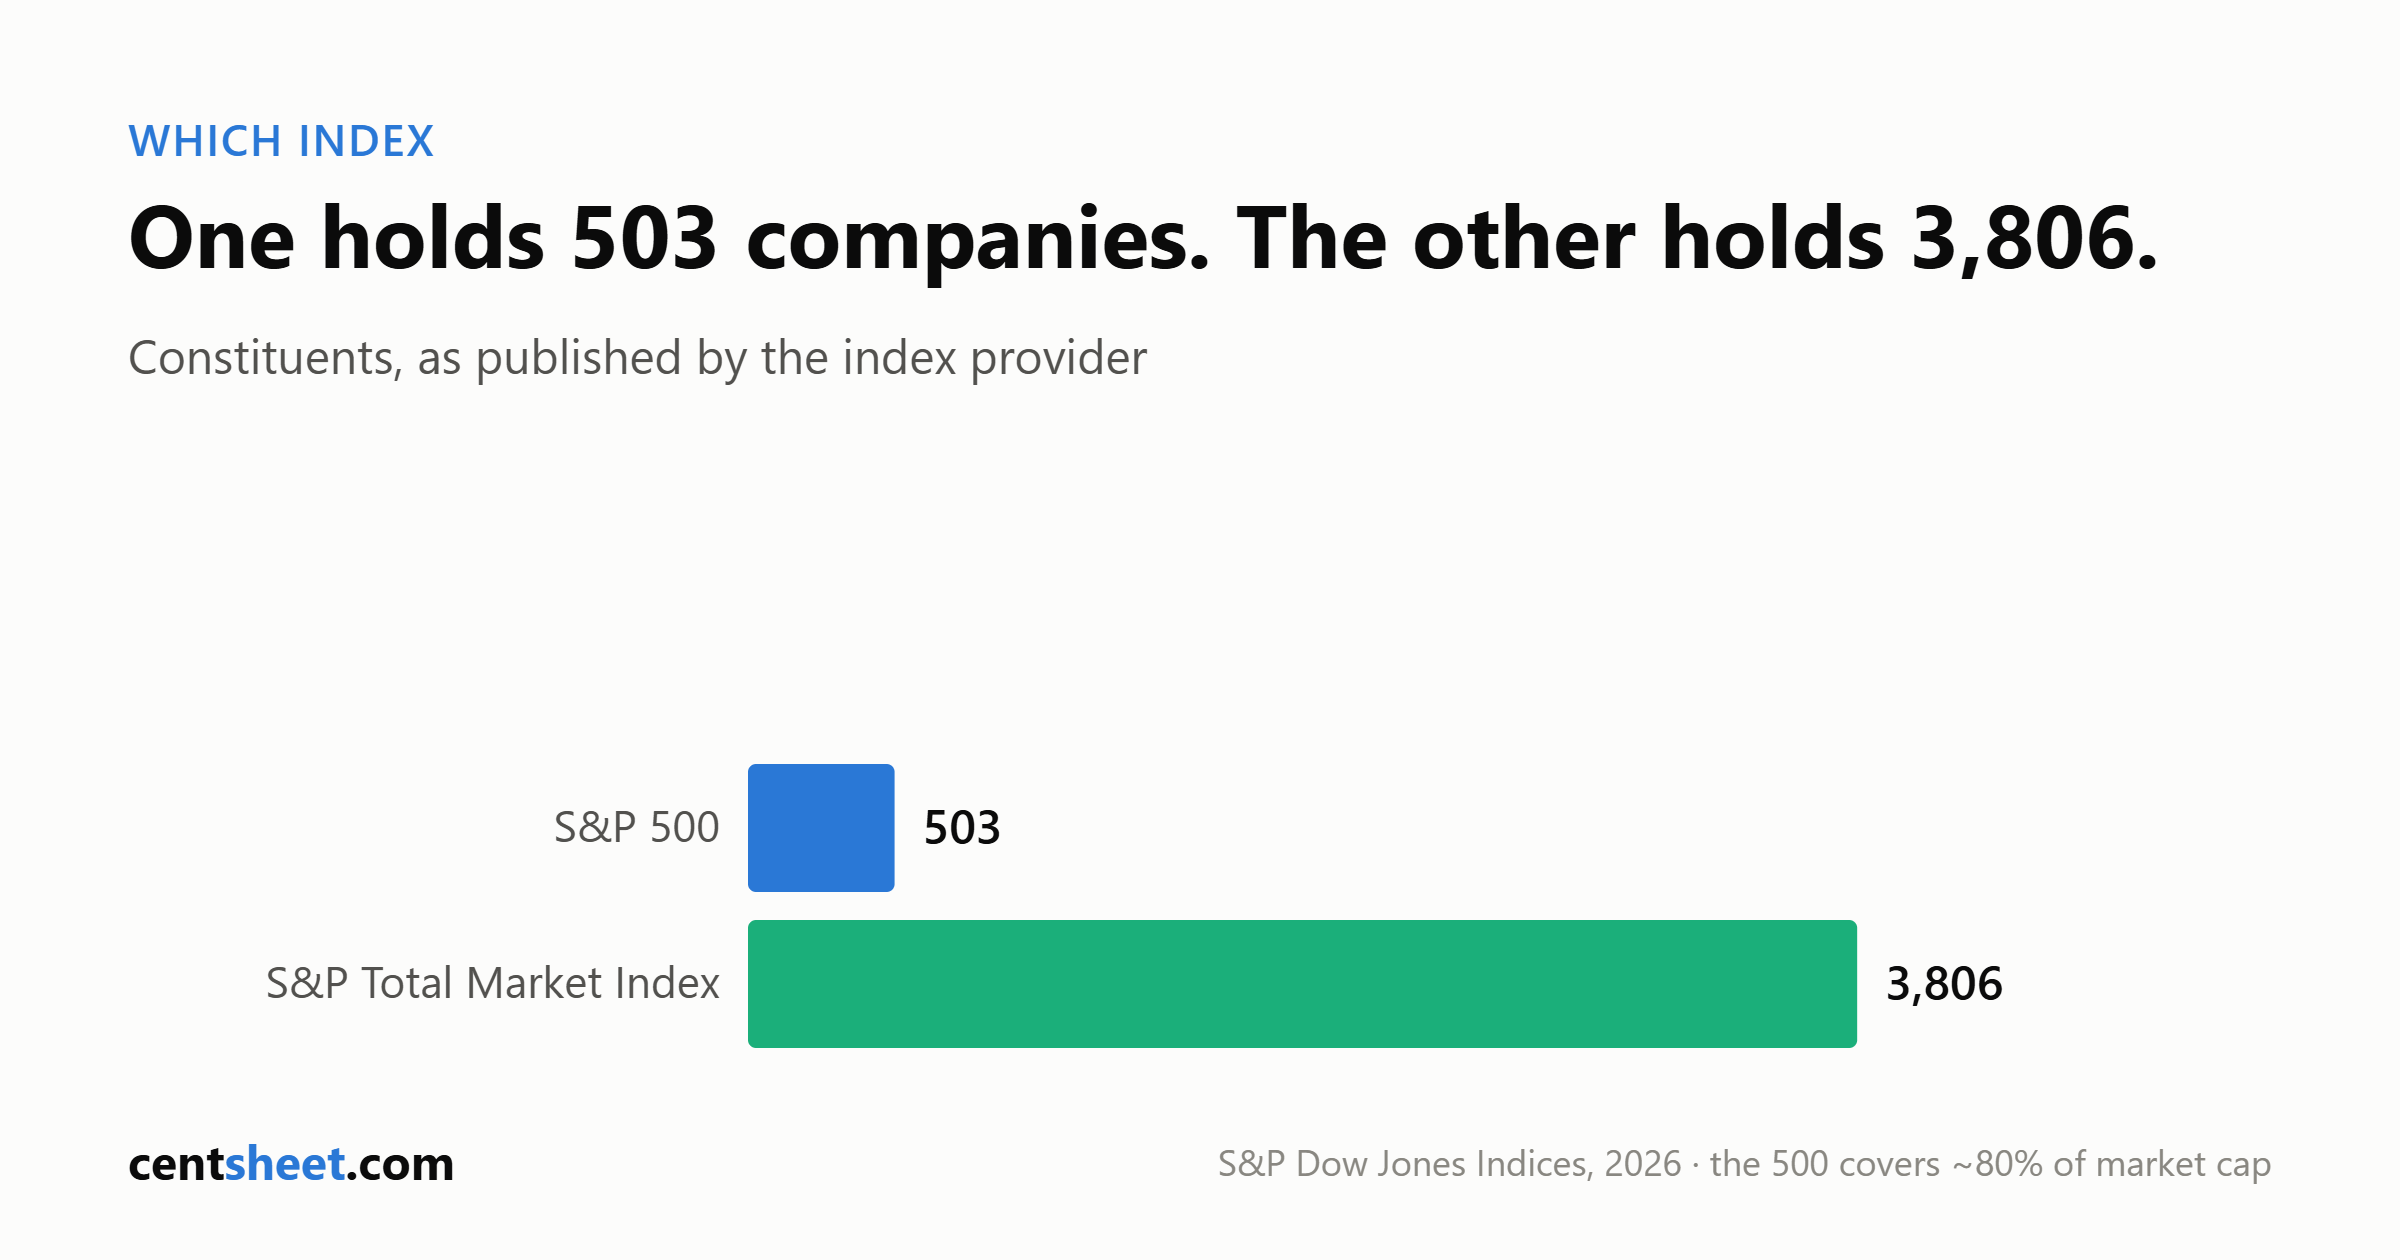
The S&P 500 does not hold 500 stocks. S&P Dow Jones Indices’ own characteristics table showed 503 constituents when we checked it on August 6, 2026 — several companies have more than one share class in the index, and Alphabet’s Class A and Class C shares both appear.
That is the smallest difference between an S&P 500 fund and a total US market fund, and fair warning about the rest. Almost every round number attached to these two indexes is wrong by a little, and the real differences are smaller than the argument about them. This supports our index funds explainer; for the wrapper rather than the index, see ETF vs index fund.
The two indexes, side by side
Both columns come from S&P Dow Jones Indices’ index pages, retrieved August 6, 2026. S&P publishes market caps in millions; bracketed conversions are ours.
| S&P 500 | S&P Total Market Index | |
|---|---|---|
| Constituents | 503 | 3,806 |
| Largest constituent | $4,862,270.39M [~$4.9T] | $4,862,270.39M [~$4.9T] |
| Smallest constituent | $5,708.40M [~$5.7B] | $0.03M [~$30,000] |
| Coverage | “approximately 80% of available market capitalization” | large-, mid-, small- and micro-cap |
The largest company is identical in both. The smallest is not close: the total market index reaches down to a constituent worth about $30,000, and carries roughly 7.5 times as many names.
S&P describes the S&P 500 as including “500 leading companies” — not the 500 largest — and rebalances it quarterly in March, June, September and December. We did not read S&P’s methodology document, so we will not describe how constituents get chosen. Note only that “leading” is the index provider’s own word, not a synonym for “biggest.”
No S&P 500 fund holds exactly 503 stocks
Five funds tracking the same index reported five different position counts:
| Fund | Positions | As of |
|---|---|---|
| Schwab S&P 500 Index (SWPPX) | 503 | 06/30/2026 |
| iShares Core S&P 500 ETF (IVV) | 504 | 08/05/2026 |
| SPDR S&P 500 ETF Trust (SPY) | 505 | 08/04/2026 |
| Vanguard S&P 500 ETF (VOO) | 506 (benchmark 503) | 06/30/2026 |
| Fidelity 500 Index (FXAIX) | 508 holdings, 502 issuers | 06/30/2026 |
Not contradictions — dates differ, share classes are counted differently, and iShares notes that index futures “may be used to offset cash and receivables” for tracking. But there is no single correct answer to how many stocks an S&P 500 fund holds, and anyone who gives you one without a fund name and a date is guessing.
The overlap is most of the money
S&P DJI says the S&P 500 covers approximately 80% of available market capitalization; Schwab repeats the figure on its own SWPPX page. By CentSheet’s arithmetic that leaves roughly 20% outside the index — assuming “available market capitalization” means the same thing in both places, which we did not verify. That 20% is what a total-market fund adds.
Fidelity publishes top-10 concentration for its own funds, all as of 06/30/2026:
| Fidelity fund | Top 10 holdings | Total holdings |
|---|---|---|
| 500 Index (FXAIX) | 36.39% | 508 |
| Total Market Index (FSKAX) | 32.15% | 3,778 |
| ZERO Total Market Index (FZROX) | 32.14% | 2,665 |
Our subtraction, not Fidelity’s: about four percentage points of top-10 weight, one issuer, one date. FXAIX’s top 10 issuers were 37.88% — higher than its top 10 holdings, the multiple-share-class effect again.
At the individual stock level, from two issuers on the same date (06/30/2026):
| Holding | Fidelity 500 Index (FXAIX) | Vanguard total-market ETF (VTI) |
|---|---|---|
| NVIDIA | 7.51% | 6.32% |
| Apple | 6.59% | 5.84% |
| Microsoft | 4.30% | 3.81% |
Roughly a percentage point of dilution per mega-cap, again our subtraction — the practical difference at the top of the portfolio. FXAIX’s regional breakdown was 99.51% United States, 0.48% Europe. Neither of these is an international fund.
Sector concentration is disclosed and bounded, but loosely. Information Technology was 37.54% of the S&P 500 Index per State Street’s breakdown as of August 5, 2026, and 37.45% of State Street’s fund and 37.39% of iShares’ IVV a day earlier. iShares states that under the 1940 Act a fund designated “diversified” must limit positions above 5% of assets so they “in the aggregate represent less than 25% of its total assets” — and that IVV “may become non-diversified… solely as a result of a change in relative market capitalization or index weighting.” We have no matching total-market breakdown, so we will not say how much lower it runs.
“Total market” is not a fixed number of stocks
Two funds naming the same benchmark reported very different holdings counts on 06/30/2026: Fidelity’s FSKAX 3,778 and Schwab’s SWTSX 2,859, both stating the Dow Jones U.S. Total Stock Market Index. iShares’ ITOT held 2,448 positions on 08/05/2026 against an S&P Total Market Index of 3,806. Vanguard’s VTI held 3,531 stocks against a benchmark of 3,482.
This is sampling, not error. The SEC’s index-fund bulletin warns that a fund “may only invest in a sampling of the securities in the market index,” in which case its performance “may be less likely to match the index.” So “a total market fund holds about X stocks” is not a stable claim.
One naming trap: Vanguard renamed several US equity index funds effective July 29, 2026, after Morningstar rebranded the CRSP Market Indexes. VTI’s page now says it tracks the Morningstar US Total Market Index; Vanguard says the changes “will not affect the funds’ investment objectives or how they are managed.” Most of the internet still says CRSP.
What the two choices cost
Expense ratios are not billed to you. Per the SEC, they come out of fund assets: “When fund fees are paid out of fund assets, the value of the fund decreases and the value of all the investors’ shares decreases.” No line item appears on a statement. Fidelity translates 0.015% into “$0.15 per $1,000,” the clearest framing any issuer offers.
| Fund | Index type | Expense ratio | Minimum | Figure as of |
|---|---|---|---|---|
| Fidelity ZERO Total Market (FZROX) | Total market, proprietary | 0.00% | $0 | 2025-12-30 |
| Fidelity 500 Index (FXAIX) | S&P 500 | 0.015% | $0 | 2026-04-29 |
| Fidelity Total Market (FSKAX) | Total market | 0.015% | $0 | 2026-04-29 |
| Schwab S&P 500 Index (SWPPX) | S&P 500 | 0.020% | No minimum | retrieved 2026-08-06 |
| Schwab Total Stock Market (SWTSX) | Total market | 0.030% | No minimum | retrieved 2026-08-06 |
| Vanguard VOO / VTI (ETFs) | S&P 500 / total market | 0.03% | — | 2026-04-28 |
| iShares IVV / ITOT (ETFs) | S&P 500 / S&P TMI | 0.03% | — | current prospectus |
| Vanguard VFIAX / VTSAX (Admiral) | S&P 500 / total market | 0.04% | $3,000 | 2026-04-28 |
| SPDR S&P 500 ETF Trust (SPY) | S&P 500 | 0.0945% | — | 2026-08-06 |
Read that sideways. Within a single index, the spread between the highest and lowest published expense ratio is wider than the gap between the two indexes’ lowest-cost options. SPY at 0.0945% is roughly three times VOO’s or IVV’s 0.03% on the same index; it is also a unit investment trust launched in January 1993, a structure outside the SEC’s Rule 6c-11.
Two caveats. FZROX shows 0.00% but tracks Fidelity’s own proprietary index, and the SEC notes that “You generally cannot transfer fractional shares to another brokerage firm” — we did not verify Fidelity’s ZERO-fund terms. And minimums do not follow the wrapper: Fidelity and Schwab index mutual funds showed $0 or “No Minimum,” Vanguard’s Admiral classes $3,000.
The SEC’s fee-drag example uses $100,000 growing 4% annually for 20 years: approximately $208,000 at a 0.25% annual fee, $198,000 at 0.50%, $179,000 at 1.00%. Those fees are far larger than anything above. The SEC does not state the gap between its own scenarios and neither will we; for the mechanism, see compound interest.
Trading costs here round to nothing: published 30-day median bid-ask spreads under Rule 6c-11 were 0.00% for SPY and 0.01% for IVV, ITOT and VOO as of August 5, 2026. We did not check thinner ETFs; do not assume the same. Turnover is low throughout — FXAIX and FZROX 2.00%, VOO 2.4%, VTI 2.6%, SWPPX 2.97%, SWTSX 3.49%, on issuer dates from 08/31/2025 to 06/30/2026.
On taxes, the tidy version does not survive the data. iShares’ IVV distribution table shows ten consecutive distributions from March 2024 through June 2026 that were 100% income, $0.000000 in capital gains. But Fidelity’s capital gains history for FXAIX — a plain mutual fund, no ETF share class — lists its most recent capital gains distribution as April 5, 2019. That does not establish that an S&P 500 ETF distributes fewer capital gains than an S&P 500 index mutual fund.
The tracking data we have
We have no total-market index return figures. No issuer page we read gave a like-for-like S&P 500 versus total-market return on the same date, so this article contains no performance comparison between the two indexes. That absence is the honest answer, not an oversight.
What the data does show is cost separating two funds tracking the same index — average annual total returns as of June 30, 2026, per each issuer’s own page:
| 10-year average annual | At NAV | At market price | Benchmark, per that issuer |
|---|---|---|---|
| iShares IVV (0.03% ER) | 15.47% | 15.44% | 15.50% |
| SPDR SPY (0.0945% ER) | 15.35% | 15.34% | 15.51% |
IVV trailed its benchmark by 0.03 percentage points a year, equal to its expense ratio. SPY trailed by more than its expense ratio. We verified the structure and the numbers but no causal mechanism from a prospectus, so we will not explain the gap.
Note the disagreement inside that table. State Street reports the S&P 500’s 10-year return as 15.51%; BlackRock reports 15.50%. Same index, same date, both retrieved August 6, 2026. Probably rounding or a different total-return series — but there is no single published number, so attribute whichever you use and do not average them.
Separately, and on a different date: Vanguard’s figures as of July 31, 2026 put its 500 Index Admiral mutual fund (VFIAX, 0.04%) and its S&P 500 ETF share class (VOO, 0.03%) both at 15.04% over 10 years at NAV, against a benchmark of 15.08%. Two wrappers, one fund, identical to two decimals. Do not set those against the IVV and SPY figures — different as-of dates.
These are trailing averages carrying the standard past-performance disclaimer. None is a forecast.
The short version
1. Pick your index and stop arguing about it. The gap at the top of the portfolio was about four points of top-10 weight, one issuer, 06/30/2026. 2. Read the expense ratio off the fund’s own page on the day you buy, with its as-of date. Every figure above is dated April to August 2026 and will move. 3. Check the position count and index name on the fund page, not on a blog. Funds naming the same total-market index reported 2,448 to 3,778 holdings. 4. Check whether the index is third-party or the issuer’s own. A 0.00% expense ratio on a proprietary index is a different product from 0.00% on a public one. 5. For a like-for-like cost comparison, FINRA’s Fund Analyzer takes up to three funds at once and compares them to the average for similar funds. It sells nothing. 6. Ignore anyone who says one of these indexes wins. Nobody publishes the number that would settle it, and the trailing returns that exist are history.
Choosing an index is a preference about what you want to own — the 500, or everything. The expense ratio, the minimum and how much you contribute are the parts you control, and our calculators handle those. Nothing will settle the index question for you.
CentSheet publishes educational content, not personalized financial advice. Nothing here is a recommendation of any specific fund, index or brokerage, and past performance does not predict future results.
Get the CentSheet Money Brief
Email me CentSheet weekly: practical money decisions, new calculators, and useful worksheets. Unsubscribe anytime.