A credit score range looks like the simplest thing in personal finance: 300 to 850, five tidy labels, done. Then you check two sites and get two different answers about whether 665 is “fair” or “prime,” and a government dataset calls 740 something a third thing.
None of them are wrong. They are different schemes, and almost nobody tells you which one they are using.
The scale, and its exceptions
Base FICO Scores run 300 to 850. VantageScore 3.0 and 4.0 also run 300 to 850. That much is genuinely standard.
Two exceptions matter:
- Industry-specific FICO Scores run 250 to 900. FICO Auto Score and FICO Bankcard Score use a wider scale, which is why a car dealer may quote you a number that looks nothing like the one in your app. “Exceptional 800+” is meaningless on a 250–900 scale.
- Old VantageScore models ran 501 to 990. VantageScore 1.0 and 2.0 used an entirely different scale; the 300–850 alignment only arrived with VantageScore 3.0 in 2013. Any pre-2013 reference point is not comparable.
FICO’s bands
FICO publishes five quality labels:
| Band | Range |
|---|---|
| Poor | below 580 |
| Fair | 580–669 |
| Good | 670–739 |
| Very Good | 740–799 |
| Exceptional | 800 and above |
A small but real precision note: FICO’s own consumer site writes the bottom band as “<580” and the top as “800+” — it does not publish them as 300–579 and 800–850. Experian publishes those closed forms. They are a reasonable derivation from the 300–850 scale, but if you see them attributed to FICO verbatim, that is an editorial tidy-up, not FICO’s wording.
FICO is also careful about what “good” means, and the hedge is the important part: “many lenders find scores above 670 as indicating good creditworthiness.” That is a description of lender convention, not a promise. These bands are not approval cutoffs. Neither FICO nor VantageScore publishes them as underwriting thresholds — every lender sets its own.
VantageScore’s tiers — different words, different lines
VantageScore does not use poor/fair/good/very good/exceptional. That vocabulary is FICO’s. VantageScore publishes four risk tiers:
| Tier | Range |
|---|---|
| Subprime | 300–600 |
| Near Prime | 601–660 |
| Prime | 661–780 |
| Superprime | 781–850 |
So the “good” line sits at 670 on FICO and 661 on VantageScore. A 665 is Fair on one model and Prime on the other. Same person, same day, different label — and neither is a mistake.
You will also see credit bureaus map friendly quality words onto VantageScore’s tiers. Those mappings are the bureau’s editorial overlay, not VantageScore’s terminology, and the bureaus are not aligned with each other on whether the labels belong to VantageScore at all. If a page shows you “Excellent” on a VantageScore, check whose label that is.
The CFPB uses VantageScore’s words with different numbers
This is the trap that catches even careful readers. The Consumer Financial Protection Bureau publishes borrower risk profiles using the same tier names — subprime, near-prime, prime, super-prime — applied to FICO Score 8, with cutoffs that look nothing like VantageScore’s:
| Tier | CFPB (on FICO 8) | VantageScore |
|---|---|---|
| Deep subprime | below 580 | — |
| Subprime | 580–619 | 300–600 |
| Near-prime | 620–659 | 601–660 |
| Prime | 660–719 | 661–780 |
| Super-prime | 720 and above | 781–850 |
A 740 is super-prime to the CFPB and merely prime to VantageScore. A 700 is prime under both, but it sits near the bottom of VantageScore’s prime band and comfortably inside CFPB’s super-prime. Do not blend these into one table — and when a news article cites “share of subprime borrowers,” check which definition it is using, because the two produce very different populations.
Which model is even looking at you
The range question has a second layer: you have dozens of scores, not one.
- FICO Score 8 is the version most widely used by lenders generally.
- Mortgage lenders use older versions — FICO Score 5 at Equifax, Score 4 at TransUnion, Score 2 at Experian.
- Auto and card lenders often use those 250–900 industry scores.
- Free score services each pick their own model and version, and rarely make it obvious.
We wrote about that mess separately in FICO vs. “credit score”. For range purposes, the practical rule: a number without a model and a version attached is not comparable to any other number.
Where the population actually sits
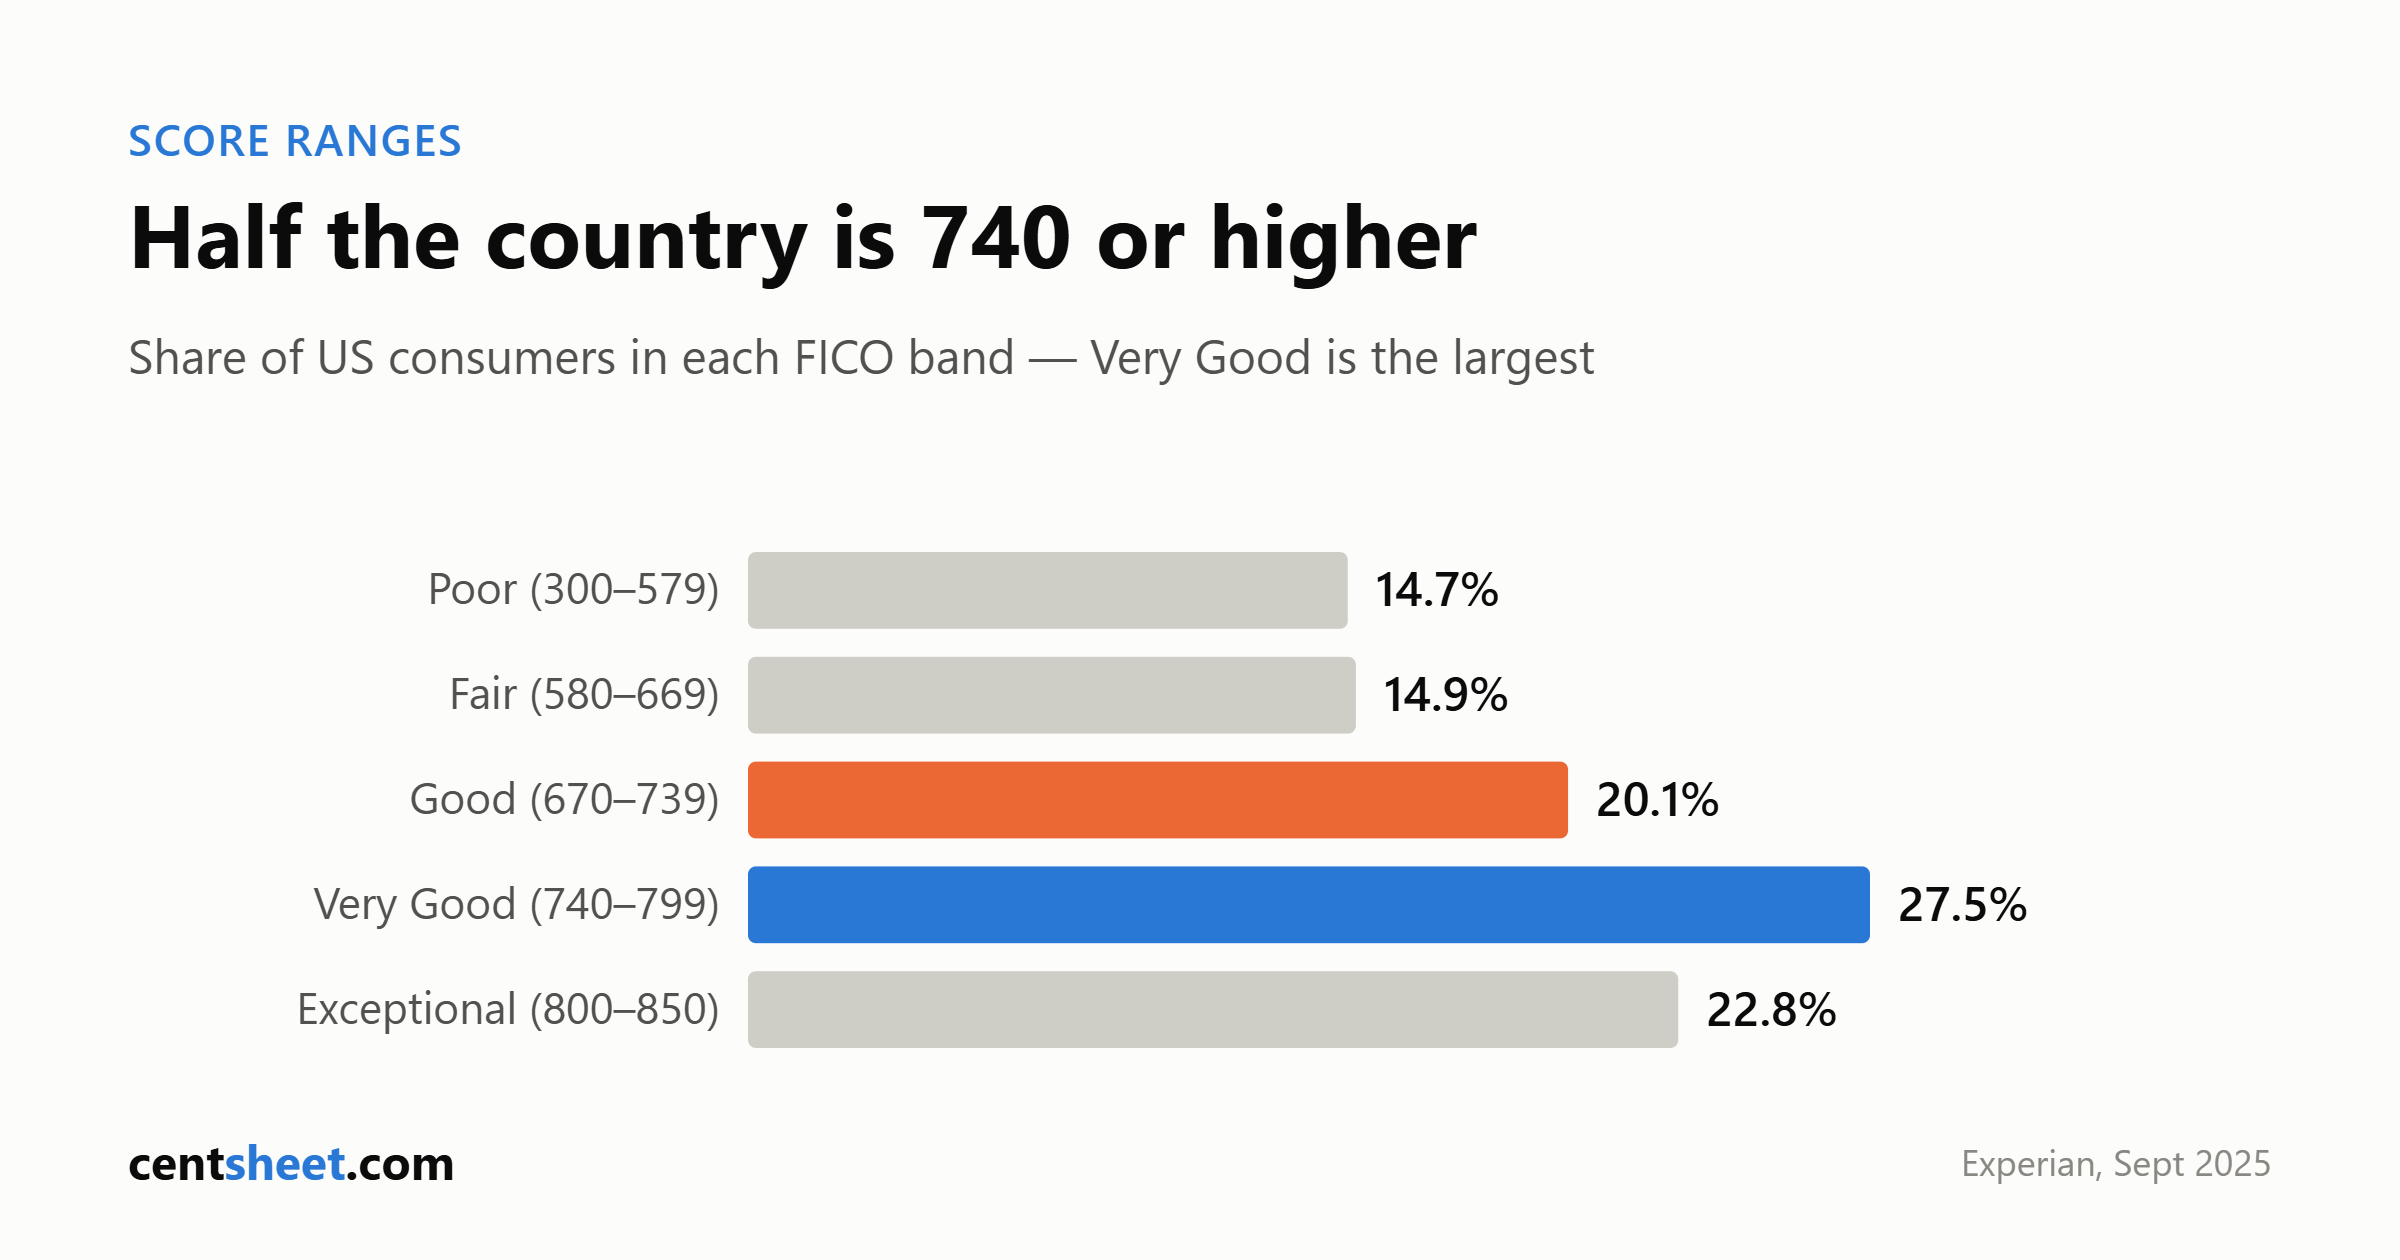
Bands mean more when you know how crowded they are. Experian’s September 2025 distribution of FICO Scores:
| Band | Share of consumers |
|---|---|
| Poor (300–579) | 14.7% |
| Fair (580–669) | 14.9% |
| Good (670–739) | 20.1% |
| Very Good (740–799) | 27.5% |
| Exceptional (800–850) | 22.8% |
About 70% of consumers sit at 670 or above. The largest single band is Very Good, not Good — the distribution is top-heavy, which is why a “good” 690 feels less impressive in practice than the label suggests. Roughly half the country is above you at that score.
The national average FICO Score is 714 as of FICO’s Spring 2026 report. We break the averages down by generation and state in What Is the Average US Credit Score?.
How to actually use a band
1. Find out which model and version produced the number before comparing it to anything. 2. Aim at the next line, not a round number. Lenders price in bands. 739 to 741 can matter; 741 to 755 usually does not. 3. Ignore the label, watch the cutoff that applies to you. For a mortgage the meaningful lines are the pricing tiers and program floors, which do not match FICO’s five labels at all. 4. Do not chase 850. The pricing benefit tops out well below it — for conventional mortgages, at 780.
And the standing caveat on everything score-related: both models are proprietary. Nobody outside those companies can tell you the exact point value of any single action, and both companies say plainly that impact depends on your entire file.
CentSheet publishes educational content, not personalized financial advice. Band definitions are publisher conventions, not lending decisions.
Get the CentSheet Money Brief
Email me CentSheet weekly: practical money decisions, new calculators, and useful worksheets. Unsubscribe anytime.